Volvo 2004 Annual Report Download - page 97
Download and view the complete annual report
Please find page 97 of the 2004 Volvo annual report below. You can navigate through the pages in the report by either clicking on the pages listed below, or by using the keyword search tool below to find specific information within the annual report.-
 1
1 -
2
-
3
-
4
-
5
-
6
-
7
-
8
-
9
-
10
-
11
-
12
-
13
-
14
-
15
-
16
-
17
-
18
-
19
-
20
-
21
-
22
-
23
-
24
-
25
-
26
-
27
-
28
-
29
-
30
-
31
-
32
-
33
-
34
-
35
-
36
-
37
-
38
-
39
-
40
-
41
-
42
-
43
-
44
-
45
-
46
-
47
-
48
-
49
-
50
-
51
-
52
-
53
-
54
-
55
-
56
-
57
-
58
-
59
-
60
-
61
-
62
-
63
-
64
-
65
-
66
-
67
-
68
-
69
-
70
-
71
-
72
-
73
-
74
-
75
-
76
-
77
-
78
-
79
-
80
-
81
-
82
-
83
-
84
-
85
-
86
-
 87
87 -
 88
88 -
 89
89 -
 90
90 -
 91
91 -
 92
92 -
 93
93 -
 94
94 -
 95
95 -
 96
96 -
 97
97 -
 98
98 -
 99
99 -
 100
100 -
 101
101 -
 102
102 -
 103
103 -
 104
104 -
 105
105 -
 106
106 -
 107
107 -
108
-
109
-
110
-
111
-
112
-
113
-
114
-
115
-
116
-
117
-
118
-
119
-
120
-
121
-
122
-
123
-
124
-
125
-
126
-
127
-
128
 |
 |

95
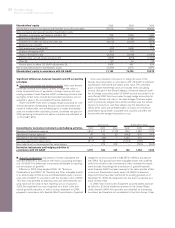
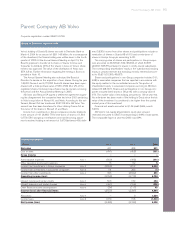
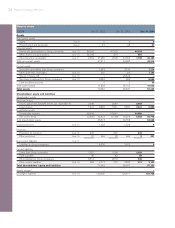
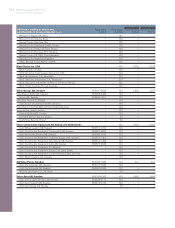
Cash-flow statements
SEK M 2002 2003 2004
Operating activities
Operating income (3,763) (2,173) 4,793
Depreciation and amortization 2 1 1
Other items not affecting cash Note 20 (815) 288 (4,726)
Changes in working capital:
Increase (–)/decrease (+) in receivables 50 18 111
Increase (+)/decrease (–) in liabilities and provisions (36) (29) (20)
Interest and similar items received 504 131 282
Interest and similar items paid (263) (175) (210)
Other financial items (8) (124) 32
Income taxes paid/received 210 (6) 75
Cash flow from operating activities (4,119) (2,069) 338
Investing activities
Investments in fixed assets (1) 0 (2)
Disposals of fixed assets 3 7 4
Shares and participations in Group companies, net Note 20 (1,544) (1,033) (670)
Shares and participations in non-Group companies, net Note 20 66 (1) 15,082
Cash flow after net investments (5,595) (3,096) 14,752
Financing activities
Increase (+)/ decrease (–) in loans Note 20 (775) (1,078) (3,180)
Loans granted, net Note 20 891 (591) 0
Dividend to AB Volvo shareholders (3,356) (3,356) (3,356)
Repurchase of own shares – – (2,532)
Change in liquid funds (8,835) (8,121) (5,684)
Liquid funds at January 1 17,880 9,045 924
Liquid funds at December 31 9,045 924 6,608
Liquid funds
Liquid funds include cash and bank balances and deposits at Volvo Treasury.
Changes in Shareholders’ equity
SEK M
Restricted equity Unrestricted Total share-
Share capital Legal reserves equity holders’ equity
Balance at December 31, 2001 2,649 7,241 62,264 72,154
Cash dividend — — (3,356) (3,356)
Net income 2002 — — (2,485) (2,485)
Balance at December 31, 2002 2,649 7,241 56,423 66,313
Cash dividend — — (3,356) (3,356)
Net income 2003 — — (2,189) (2,189)
Balance at December 31, 2003 2,649 7,241 50,878 60,768
Cash dividend — — (3,356) (3,356)
Distribution of shares in Ainax AB to shareholders — — (6,310) (6,310)
Repurchase of own shares — — (2,532) (2,532)
Net income 2004 — — 5,098 5,098
Balance at December 31, 2004 2,649 7,241 43,778 53,668
The distribution of share capital by class of shares is shown in Note 20 to the consolidated financial statements.