Volvo 2004 Annual Report Download - page 116
Download and view the complete annual report
Please find page 116 of the 2004 Volvo annual report below. You can navigate through the pages in the report by either clicking on the pages listed below, or by using the keyword search tool below to find specific information within the annual report.-
 1
1 -
2
-
3
-
4
-
5
-
6
-
7
-
8
-
9
-
10
-
11
-
12
-
13
-
14
-
15
-
16
-
17
-
18
-
19
-
20
-
21
-
22
-
23
-
24
-
25
-
26
-
27
-
28
-
29
-
30
-
31
-
32
-
33
-
34
-
35
-
36
-
37
-
38
-
39
-
40
-
41
-
42
-
43
-
44
-
45
-
46
-
47
-
48
-
49
-
50
-
51
-
52
-
53
-
54
-
55
-
56
-
57
-
58
-
59
-
60
-
61
-
62
-
63
-
64
-
65
-
66
-
67
-
68
-
69
-
70
-
71
-
72
-
73
-
74
-
75
-
76
-
77
-
78
-
79
-
80
-
81
-
82
-
83
-
84
-
85
-
86
-
87
-
88
-
89
-
90
-
91
-
92
-
93
-
94
-
95
-
96
-
97
-
98
-
99
-
100
-
101
-
102
-
103
-
104
-
105
-
 106
106 -
 107
107 -
 108
108 -
 109
109 -
 110
110 -
 111
111 -
 112
112 -
 113
113 -
 114
114 -
 115
115 -
 116
116 -
 117
117 -
 118
118 -
 119
119 -
 120
120 -
 121
121 -
 122
122 -
 123
123 -
 124
124 -
 125
125 -
 126
126 -
127
-
128
 |
 |

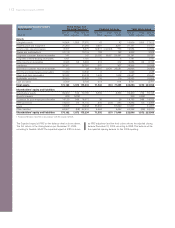
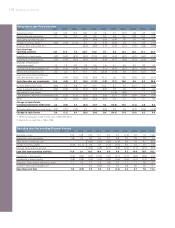
114 Expected impact of IFRS
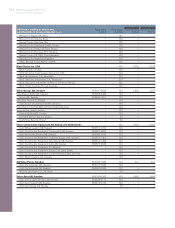
Consolidated income statements IFRS comparison
Volvo Group (VFS reported according to the equity method)
SEK M unless otherwise specified IFRS Sw GAAP
Net sales 202,171 201,496
Cost of sales (158,453) (158,231)
Gross income 43,718 43,265
Research and development expenses (7,614) (7,233)
Selling expenses (18,317) (18,048)
Administrative expenses (5,310) (5,321)
Other operating income and expenses 7 (658)
Income from Financial Services 1,365 1,365
Income from investments in
associated companies 2 2
Income from other investments 828 828
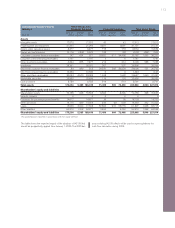
Operating income (loss) 14,679 14,200
Interest income and similar credits 993 993
Interest expenses and similar charges (1,426) (1,404)
Other financial income and expenses (1,210) (1,210)
Income after financial items 13,036 12,579
Minority –(40)
Income taxes (3,129) (3,184)
Net income19,907 9,355
1Attributable to:
Equity holders 9,867 –
Minority 40 –
9,907 –
Depreciation and amortization included above
Depreciation
Industrial and Commercial (5,542) (5,540)
Financial Services (3,064) (3,066)
Total Depreciation (8,606) (8,606)
Amortization
Industrial and Commercial (951) (1,635)
Financial Services (63) (63)
Total Amortization (1,014) (1,698)
Income per share, SEK 23.67 22.35
Average number of shares, million 418.5 418.5