Volvo 2004 Annual Report Download - page 75
Download and view the complete annual report
Please find page 75 of the 2004 Volvo annual report below. You can navigate through the pages in the report by either clicking on the pages listed below, or by using the keyword search tool below to find specific information within the annual report.-
 1
1 -
2
-
3
-
4
-
5
-
6
-
7
-
8
-
9
-
10
-
11
-
12
-
13
-
14
-
15
-
16
-
17
-
18
-
19
-
20
-
21
-
22
-
23
-
24
-
25
-
26
-
27
-
28
-
29
-
30
-
31
-
32
-
33
-
34
-
35
-
36
-
37
-
38
-
39
-
40
-
41
-
42
-
43
-
44
-
45
-
46
-
47
-
48
-
49
-
50
-
51
-
52
-
53
-
54
-
55
-
56
-
57
-
58
-
59
-
60
-
61
-
62
-
63
-
64
-
 65
65 -
 66
66 -
 67
67 -
 68
68 -
 69
69 -
 70
70 -
 71
71 -
 72
72 -
 73
73 -
 74
74 -
 75
75 -
 76
76 -
 77
77 -
 78
78 -
 79
79 -
 80
80 -
 81
81 -
 82
82 -
 83
83 -
 84
84 -
 85
85 -
86
-
87
-
88
-
89
-
90
-
91
-
92
-
93
-
94
-
95
-
96
-
97
-
98
-
99
-
100
-
101
-
102
-
103
-
104
-
105
-
106
-
107
-
108
-
109
-
110
-
111
-
112
-
113
-
114
-
115
-
116
-
117
-
118
-
119
-
120
-
121
-
122
-
123
-
124
-
125
-
126
-
127
-
128
 |
 |

73
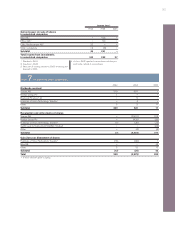
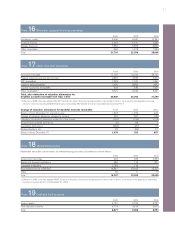
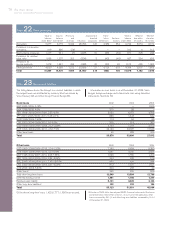
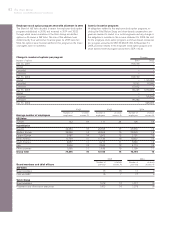
Pension costs 2002 2003 2004
Current service costs 646 616
Interest costs 1,377 1,306
Expected return on plan assets (828) (931)
Actuarial gains and losses1–(4)
Past service costs
– Unvested –7
– Vested 46 38
Curtailments and settlements 3(28)
Termination benefits 169 729
Pension costs for defined benefit plans 1,413 1,733
Pension costs for defined contribution plans 2,461 2,681
Total pension costs 4,472 3,874 4,414
1 For each plan, actuarial gains and losses are reported as income or expenses, when the accumulated amount exceeds the so called corridor. The income or
expenses are then recognized over the expected average remaining service period of the employees.
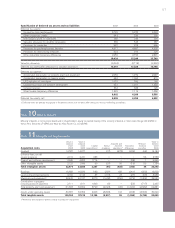
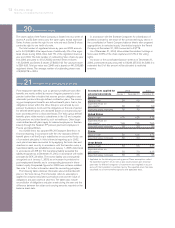
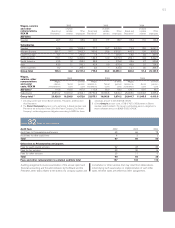
Costs for post-employment benefits other than pensions 2003 2004
Current service costs 107 196
Interest costs 415 349
Expected return on plan assets 0 (12)
Actuarial gains and losses 1–6
Past service costs
– Unvested –(1)
– Vested –5
Curtailments and settlements (4) –
Termination benefits 32 47
Total costs for post-employment benefits other than pensions 550 590
1 Actuarial gains and losses are for each plan reported as income or expenses, when the accumulated amount exceed the so called corridor. The income or
expenses are then recognized over the expected average remaining service period of the employees.
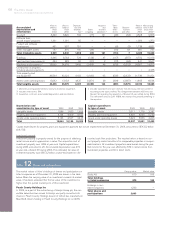
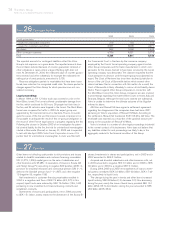
An increase of one percentage point per year in healthcare costs
would change the accumulated post-employment benefit obligation
as of December 31, 2004 by approximately 170, and the post-
employment benefit expense by approximately 15. A decrease of 1%
would decrease the accumulated value of obligations by about 145
and reduce costs by approximately 12.
Calculations made as of December 31, 2004 show an annual
increase of 10.0% in the weighted average per capita costs of
covered healthcare benefits; it is assumed that the percentage will
decline gradually to 5% and then remain at that level.