Volvo 2004 Annual Report Download - page 13
Download and view the complete annual report
Please find page 13 of the 2004 Volvo annual report below. You can navigate through the pages in the report by either clicking on the pages listed below, or by using the keyword search tool below to find specific information within the annual report.-
 1
1 -
2
-
 3
3 -
 4
4 -
 5
5 -
 6
6 -
 7
7 -
 8
8 -
 9
9 -
 10
10 -
 11
11 -
 12
12 -
 13
13 -
 14
14 -
 15
15 -
 16
16 -
 17
17 -
 18
18 -
 19
19 -
 20
20 -
 21
21 -
 22
22 -
 23
23 -
24
-
25
-
26
-
27
-
28
-
29
-
30
-
31
-
32
-
33
-
34
-
35
-
36
-
37
-
38
-
39
-
40
-
41
-
42
-
43
-
44
-
45
-
46
-
47
-
48
-
49
-
50
-
51
-
52
-
53
-
54
-
55
-
56
-
57
-
58
-
59
-
60
-
61
-
62
-
63
-
64
-
65
-
66
-
67
-
68
-
69
-
70
-
71
-
72
-
73
-
74
-
75
-
76
-
77
-
78
-
79
-
80
-
81
-
82
-
83
-
84
-
85
-
86
-
87
-
88
-
89
-
90
-
91
-
92
-
93
-
94
-
95
-
96
-
97
-
98
-
99
-
100
-
101
-
102
-
103
-
104
-
105
-
106
-
107
-
108
-
109
-
110
-
111
-
112
-
113
-
114
-
115
-
116
-
117
-
118
-
119
-
120
-
121
-
122
-
123
-
124
-
125
-
126
-
127
-
128
 |
 |

11
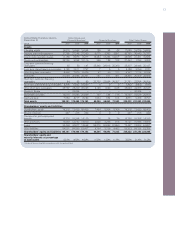
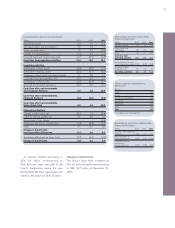
Consolidated income statements1
SEKM 2002 2003 2004
Net sales 177,080 174,768 201,496
Cost of sales (145,453) (141,256) (158,231)
Gross income 31,627 33,512 43,265
Research and development expenses (5,869) (6,829) (7,233)
Selling expenses (15,393) (15,891) (18,048)
Administrative expenses (5,464) (5,259) (5,321)
Other operating income and expenses (2,989) (540) (658)
Income from Financial Services 490 926 1,365
Income from investments in
associated companies 126 166 2
Income from other investments 309 (3,581) 828
Operating income 2,837 2,504 14,200
Interest income and similar credits 1,246 1,193 993
Interest expenses and similar charges (1,870) (1,984) (1,404)
Other financial income and expenses2(200) (56) (1,210)
Income after financial items 2,013 1,657 12,579
Income taxes (590) (1,334) (3,184)
Minority interests in net income (30) (25) (40)
Net income 1,393 298 9,355
Income per share, SEK 3.32 0.71 22.35
1 Financial Services reported in accordance with the equity method.
2 2004 includes a write-down relating to the holding in Henlys Group Plc of SEK 1,196 M.
Operating margin
%2002 2003 2004
Trucks 1.0 3.4 6.6
Buses (0.7) (3.0) 1.5
Construction Equipment 1.9 3.9 5.5
Volvo Penta 8.4 9.1 10.3
Volvo Aero 0.1 (0.5) 5.4
Volvo Group11.4 3.5 6.6
Volvo Group 1.6 1.4 7.0
1Excluding revaluation of shares in Scania AB and
Henlys Group Plc and dividend received from
Scania AB.
Change in operating income
SEK bn
Operating income 2003 2,5
Higher volumes and improvement
of gross margins 10,8
Higher income from Financial Services 0,4
Changes in currency exchange rates (1,8)
Higher capitalization of development costs 0,4
Higher research and development
expenditures (1,0)
Higher selling and administrative expenses (1,7)
Dividend from Scania 2003 (0,5)
Revaluation of shares in Scania
and Henlys Group 4,9
Other 0,2
Operating income 2004 14,2
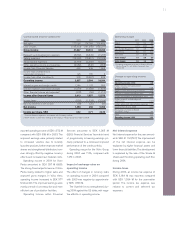
reported operating income of SEK 1,572 M
compared with SEK 908 M in 2003. The
improved earnings were primarily related
to increased volumes due to recently
launched products, further improved market
shares and strengthened distribution, how-
ever strongly offset by negative currency
effects and increased raw material costs.
Operating income in 2004 for Volvo
Penta amounted to SEK 937 M (695).
The strong financial performance of Volvo
Penta mainly related to higher sales and
improved gross margins. In Volvo Aero,
operating income increased to SEK 377
M (loss:44). The improved earnings were
mainly a result of cost reduction and more
efficient use of production facilities.
Operating income within Financial
Services amounted to SEK 1,365 M
(926). Financial Services’ favorable trend
of progressively increasing earnings pri-
marily pertained to a continued improved
performance of the credit portfolio.
Operating margin for the Volvo Group
during 2004 was 7.0%, compared with
1.4% in 2003.
Impact of exchange rates on
operating income
The effect of changes in currency rates
on operating income in 2004 compared
with 2003 was negative by approximate-
ly SEK 1,800 M.
The Swedish krona strengthened dur-
ing 2004 against the US dollar, with nega-
tive effects on operating income.
Net interest expense
Net interest expense for the year amount-
ed to SEK 411 M (791). The improvement
of the net interest expense can be
explained by higher financial assets and
lower financial liabilities. This development
is explained by the sale of the Scania B
shares and the strong operating cash flow
during 2004.
Income taxes
During 2004, an income tax expense of
SEK 3,184 M was reported, compared
with SEK 1,334 M for the year-earlier
period. The income tax expense was
related to current and deferred tax
expenses.