Volvo 2004 Annual Report Download - page 121
Download and view the complete annual report
Please find page 121 of the 2004 Volvo annual report below. You can navigate through the pages in the report by either clicking on the pages listed below, or by using the keyword search tool below to find specific information within the annual report.-
 1
1 -
2
-
3
-
4
-
5
-
6
-
7
-
8
-
9
-
10
-
11
-
12
-
13
-
14
-
15
-
16
-
17
-
18
-
19
-
20
-
21
-
22
-
23
-
24
-
25
-
26
-
27
-
28
-
29
-
30
-
31
-
32
-
33
-
34
-
35
-
36
-
37
-
38
-
39
-
40
-
41
-
42
-
43
-
44
-
45
-
46
-
47
-
48
-
49
-
50
-
51
-
52
-
53
-
54
-
55
-
56
-
57
-
58
-
59
-
60
-
61
-
62
-
63
-
64
-
65
-
66
-
67
-
68
-
69
-
70
-
71
-
72
-
73
-
74
-
75
-
76
-
77
-
78
-
79
-
80
-
81
-
82
-
83
-
84
-
85
-
86
-
87
-
88
-
89
-
90
-
91
-
92
-
93
-
94
-
95
-
96
-
97
-
98
-
99
-
100
-
101
-
102
-
103
-
104
-
105
-
106
-
107
-
108
-
109
-
110
-
 111
111 -
 112
112 -
 113
113 -
 114
114 -
 115
115 -
 116
116 -
 117
117 -
 118
118 -
 119
119 -
 120
120 -
 121
121 -
 122
122 -
 123
123 -
 124
124 -
 125
125 -
 126
126 -
 127
127 -
 128
128
 |
 |

119
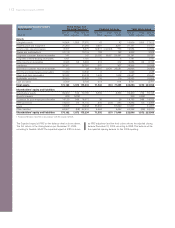
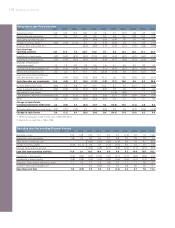
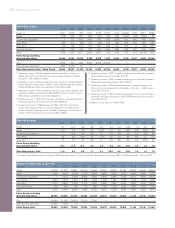
Key ratios
1994 1995 1996 1997 1998 1999 2000 2001 2002 2003 2004
Gross margin, % 1, 2 26.2 25.1 22.3 24.4 23.2 20.3 19.3 17.2 17.9 19.2 21.5
Research and development expenses
as percentage of net sales 1, 2 3.0 4.3 5.3 4.9 4.9 3.9 4.1 3.0 3.3 3.9 3.6
Selling expenses as percent of net sales 1, 2 10.1 10.2 9.5 9.4 9.0 7.0 7.7 8.1 8.7 9.1 9.0
Administration expenses as
percentage of net sales 1, 2 4.9 4.3 4.3 3.9 3.9 4.0 3.9 3.6 3.1 3.0 2.6
Return on shareholders’ equity, % 36.5 19.3 23.7 17.2 13.0 34.9 5.0 neg 1.7 0.4 13.2
Interest coverage, times 5.5 4.6 5.5 5.8 9.6 23.1 4.5 neg 2.2 1.9 10.8
Self-financing ratio, % 3247 151 73 115 78 108 89 125 176 204 241
Self-financing ratio excluding
Financial Services, % 3190 87 181 108 127 72 137 196 243 266
Net financial position, SEK M (6,999) 201 10,672 16,956 12,232 28,758 9,392 (7,042) (6,063) (2,426) 18,667
Net financial position as
percentage of shareholders’
equity and minority interests (15.9) 0.4 18.3 27.0 17.4 29.3 10.6 (8.2) (7.7) (3.3) 26.8
Shareholders’ equity and minority interests
as percentage of total assets 31.9 37.4 41.4 38.1 34.1 50.2 44.3 32.8 32.8 31.4 31.2
Shareholders’ equity and minority interests
as percentage of total assets, excluding
Financial Services 35.1 41.9 49.4 53.1 51.2 67.3 60.8 41.8 42.4 40.5 40.0
Shareholders’ equity as
percentage of total assets 31.3 36.9 41.0 37.6 33.7 49.9 44.0 32.6 32.7 31.3 31.1
1Key ratios are stated in accordance with the new 1997 Annual Accounts
Act. Figures for the years 1994 through 1996 have been adjusted to con-
form with the new principle.
21994–1996 including Financial Services. As from 1997 Financial Services
is accounted by the equity method.
3As of 1999, Volvo’s cash-flow statement is presented in accordance with the
Swedish Financial Accounting Standards Council's recommendation,
Reporting of Cash Flow, RR 7. Values in prior years are adjusted in accor-
dance with the new presentation form.
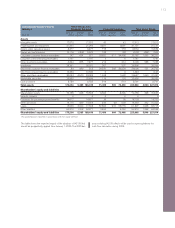
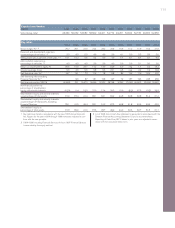
Exports from Sweden
SEKM 1994 1995 1996 1997 1998 1999 2000 2001 2002 2003 2004
Volvo Group, total 43,330 56,059 54,589 58,569 64,401 52,719 46,251 50,394 52,730 49,300 62,653