Volvo 2004 Annual Report Download - page 86
Download and view the complete annual report
Please find page 86 of the 2004 Volvo annual report below. You can navigate through the pages in the report by either clicking on the pages listed below, or by using the keyword search tool below to find specific information within the annual report.-
 1
1 -
2
-
3
-
4
-
5
-
6
-
7
-
8
-
9
-
10
-
11
-
12
-
13
-
14
-
15
-
16
-
17
-
18
-
19
-
20
-
21
-
22
-
23
-
24
-
25
-
26
-
27
-
28
-
29
-
30
-
31
-
32
-
33
-
34
-
35
-
36
-
37
-
38
-
39
-
40
-
41
-
42
-
43
-
44
-
45
-
46
-
47
-
48
-
49
-
50
-
51
-
52
-
53
-
54
-
55
-
56
-
57
-
58
-
59
-
60
-
61
-
62
-
63
-
64
-
65
-
66
-
67
-
68
-
69
-
70
-
71
-
72
-
73
-
74
-
75
-
 76
76 -
 77
77 -
 78
78 -
 79
79 -
 80
80 -
 81
81 -
 82
82 -
 83
83 -
 84
84 -
 85
85 -
 86
86 -
 87
87 -
 88
88 -
 89
89 -
 90
90 -
 91
91 -
 92
92 -
 93
93 -
 94
94 -
 95
95 -
 96
96 -
97
-
98
-
99
-
100
-
101
-
102
-
103
-
104
-
105
-
106
-
107
-
108
-
109
-
110
-
111
-
112
-
113
-
114
-
115
-
116
-
117
-
118
-
119
-
120
-
121
-
122
-
123
-
124
-
125
-
126
-
127
-
128
 |
 |

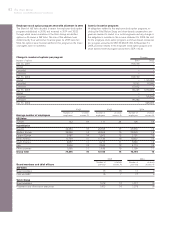
84 The Volvo Group
Notes to consolidated financial statements
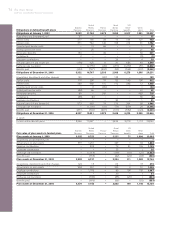
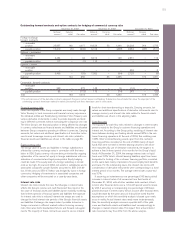
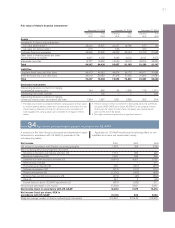
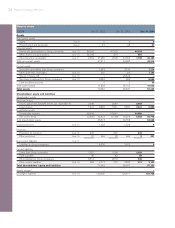
Currencies, average contract rates and maturities of outstanding forward contracts and option contracts as of
December 31, 2004 for hedging of commercial currency risks
Other Fair
Currencies currencies value 2
Net flow Net flow Net flow
Million USD GBP EUR Net SEK
Due date 2005 amount 1,058 168 441 4,005
rate17.42 13.44 9.15
Due date 2006 amount 131 – 75 (158)
rate17.86 – 9.23
Due date 2007 amount 78 – – (131)
rate17.39 – –
Total 1,267 168 516 3,716
of which, option contracts 267 – 187 (838)
Fair value of forward and
option contracts, SEK M 21,134 118 122 (3) 1,371
1Average forward contract rate.
2 Outstanding forward contracts valued at market rates.
Net flows per currency 2004 Other
Currencies Currencies Total
Million USD GBP EUR Net SEK
Net flows 2004 amount 1,782 314 735
rate 37.3655 13.4515 9.1408
Net flows SEK M, 313,100 4,200 6,700 12,100 36,100
Hedged portion, % 459 54 60
3Average exchange rate during the financial year.
4Outstanding currency contracts, regarding commercial exposure due in 2005, percentage of net flows 2004.
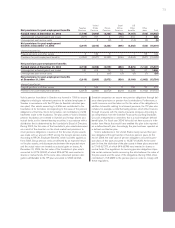
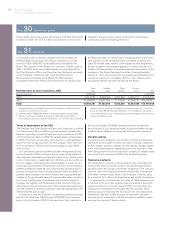
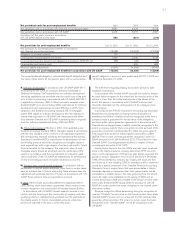
Note 33Financial risks and instruments
In its operations, the Volvo Group is exposed to various types of
financial risks. Groupwide policies, which are updated and decided
upon annually, form the basis of each Group company’s management
of these risks. The objectives of the Group’s policies for manage-
ment of financial risks are to optimize the Group’s capital costs by
utilizing economies of scale, to minimize negative effects on income
as result of changes in currency or interest rates, to optimize risk
exposure and to clarify areas of responsibilities within the Group’s
finance and treasury activities. Monitoring and control of that estab-
lished policies are adhered to is conducted continuously centrally
and at each group company. Most of the Volvo Group’s financial
transactions are carried out through Volvo’s inhouse bank, Volvo
Treasury, which conducts its operations within established risk man-
dates and limits. Credit risks are mainly managed by the different
business areas.
The nature of the various financial risks and objectives and policies
for the management of these risks are described in the sections
below. When applicable, information is also presented about the
carrying values and fair values of Volvo’s holdings of financial instru-
ments at the balance sheet date. Volvo’s accounting policies for
financial instruments are described in Note 1. In calculating the fair
values of financial instruments, Volvo has primarily used official rates
or prices quoted on the capital markets. In their absence, the valu-
ation has been made by discounting future cash flows at the market
interest rate for each maturity. In the case of instruments with matu-
rities shorter than three months, the carrying value has been
assumed to closely approximate the fair value. All reported fair
values are calculated values that will not necessarily be realized.
Currency risks
Currency risks in Volvo’s operations are related to changes in the
value of contracted and projected future flows of payments (com-
mercial currency risks), to changes in the value of loans and financial
investments (financial currency risks) and to changes in the value of
assets and liabilities in foreign subsidiaries (equity currency risks).
The objective of Volvo’s management of currency risks is to minimize
short-term negative impact on Volvo’s income and financial position
as a consequence of changes in currency exchange rates.
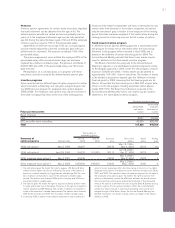
Commercial currency risks
Volvo uses forward contracts and currency options to hedge the
value of future payments in foreign currencies. According to the
Group’s currency policy, between 50% and 80% of the projected net
flow in each currency is hedged for the coming 6 months, 30% to
60% for months 7 through 12 and firm flows beyond 12 months
should normally be fully hedged. The notional amount of all forward
and option contracts outstanding as of December 31, 2004 was
SEK 19.9 billion (16.5; 20.9). The fair value of these contracts
amounted on the same date to 1,371. If assuming an instantaneous
10% strengthening of the SEK versus all other currencies, the fair
value would amount to 3,377. If assuming an instantaneous 10%
weakening of the SEK versus all other currencies the fair value
would be negative of 635. Actual foreign currency rates rarely move
instantaneously in the same direction and the actual impact of
exchange rate changes may thus differ from the above sensitivity
analyses. Further specifications of outstanding contracts are included
in the tables below.