Volvo 2004 Annual Report Download - page 26
Download and view the complete annual report
Please find page 26 of the 2004 Volvo annual report below. You can navigate through the pages in the report by either clicking on the pages listed below, or by using the keyword search tool below to find specific information within the annual report.-
 1
1 -
2
-
3
-
4
-
5
-
6
-
7
-
8
-
9
-
10
-
11
-
12
-
13
-
14
-
15
-
 16
16 -
 17
17 -
 18
18 -
 19
19 -
 20
20 -
 21
21 -
 22
22 -
 23
23 -
 24
24 -
 25
25 -
 26
26 -
 27
27 -
 28
28 -
 29
29 -
 30
30 -
 31
31 -
 32
32 -
 33
33 -
 34
34 -
 35
35 -
 36
36 -
37
-
38
-
39
-
40
-
41
-
42
-
43
-
44
-
45
-
46
-
47
-
48
-
49
-
50
-
51
-
52
-
53
-
54
-
55
-
56
-
57
-
58
-
59
-
60
-
61
-
62
-
63
-
64
-
65
-
66
-
67
-
68
-
69
-
70
-
71
-
72
-
73
-
74
-
75
-
76
-
77
-
78
-
79
-
80
-
81
-
82
-
83
-
84
-
85
-
86
-
87
-
88
-
89
-
90
-
91
-
92
-
93
-
94
-
95
-
96
-
97
-
98
-
99
-
100
-
101
-
102
-
103
-
104
-
105
-
106
-
107
-
108
-
109
-
110
-
111
-
112
-
113
-
114
-
115
-
116
-
117
-
118
-
119
-
120
-
121
-
122
-
123
-
124
-
125
-
126
-
127
-
128
 |
 |

Business environment
The consolidation trend toward large bus
operators continues, however there is still
potential for small companies in the
coach segment. The large operators dom-
inate the market and they focus on relia-
bility and life-cycle cost. They want to
cooperate with a few suppliers who can
offer complete solutions: vehicles, finan-
cing, after-market and various forms of
software solutions.
Regional authorities and large cities
are placing heavy demands on bus safety
and minimal environmental impact. They
are considering and demanding vehicles
that operate on alternative fuels.
Market share development
Volvo invoiced 8,232 (7,817) buses and
bus chassis during 2004. Increased sales
were reported from many markets, includ-
ing Europe, North America, South
America and parts of Asia. However,
volumes were lower in Mexico and China.
Volvo’s market shares in Europe
remained at about the same level as in
2003. Volvo remains the market leader in
the Nordic region and the UK. Prévost
reported higher market shares for its
coaches, while Volvo lost market share in
China and in Mexico for coaches.
Financial performance
Net sales during 2004 rose to SEK
24 Board of Directors’ Report
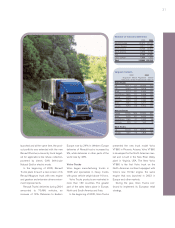
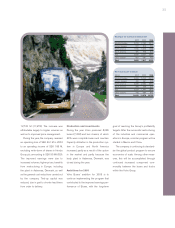
Volvo Buses has a broad range of modern
buses that offer efficient transport solu-
tions. The product offering includes com-
plete buses and chassis for city and inter-
city traffic as well as coaches.
In 2004, new versions of Volvo’s
coaches, the Volvo 9700 and 9900, and
Volvo’s global bus chassis, B7R, were
launched. In Mexico, two new models for
intercity and tourist traffic, the Volvo 9300
and 8300, were introduced. The company
also continued its broadening of a com-
plete offering to customers, including
such actions as opening new Bus Service
Centers and introducing new variations of
service contracts.
As part of the restructuring of the bus
manufacturer Henlys Group plc, Volvo
Group reached an agreement to acquire
the remaining 50% of the North American
bus manufacturer Prévost Car Inc., con-
taining the Prévost and Nova brands.
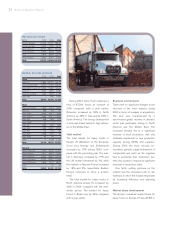
Total market
The total bus market rose in most parts of
the world during 2004, except in Mexico.
However, price pressure remained strong
in many markets. The total volume in
Europe and North America increased
moderately, with the largest percentage
increase occurring in South America.
Economic growth in Asia remained strong
and bus sales continued to rise in many
countries.
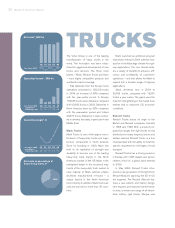
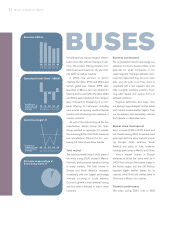
BUSES
00 01 03 04
17.2 16.7 14. 0
00 01 03
00 01 02 04
02
12.0
02
03
0
0
Net sales, SEK bn
04
Operating income (loss)*, SEK M
* excluding re-
structuring costs
and write-down
of shares
* excluding re-
structuring costs
and write-down
of shares
440 (524) (94) (361)
2.6 (3.1) (0.7)(3.0)
Operating margin*, %
Net sales as percentage of
Volvo Group sales, %
12.7
185
1.5
6%