Volvo 2004 Annual Report Download - page 66
Download and view the complete annual report
Please find page 66 of the 2004 Volvo annual report below. You can navigate through the pages in the report by either clicking on the pages listed below, or by using the keyword search tool below to find specific information within the annual report.-
 1
1 -
2
-
3
-
4
-
5
-
6
-
7
-
8
-
9
-
10
-
11
-
12
-
13
-
14
-
15
-
16
-
17
-
18
-
19
-
20
-
21
-
22
-
23
-
24
-
25
-
26
-
27
-
28
-
29
-
30
-
31
-
32
-
33
-
34
-
35
-
36
-
37
-
38
-
39
-
40
-
41
-
42
-
43
-
44
-
45
-
46
-
47
-
48
-
49
-
50
-
51
-
52
-
53
-
54
-
55
-
 56
56 -
 57
57 -
 58
58 -
 59
59 -
 60
60 -
 61
61 -
 62
62 -
 63
63 -
 64
64 -
 65
65 -
 66
66 -
 67
67 -
 68
68 -
 69
69 -
 70
70 -
 71
71 -
 72
72 -
 73
73 -
 74
74 -
 75
75 -
 76
76 -
77
-
78
-
79
-
80
-
81
-
82
-
83
-
84
-
85
-
86
-
87
-
88
-
89
-
90
-
91
-
92
-
93
-
94
-
95
-
96
-
97
-
98
-
99
-
100
-
101
-
102
-
103
-
104
-
105
-
106
-
107
-
108
-
109
-
110
-
111
-
112
-
113
-
114
-
115
-
116
-
117
-
118
-
119
-
120
-
121
-
122
-
123
-
124
-
125
-
126
-
127
-
128
 |
 |

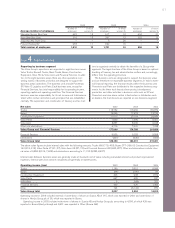
64 The Volvo Group
Notes to consolidated financial statements
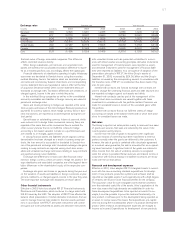
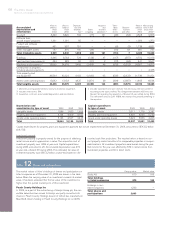
Total assets 2002 2003 2004
Sweden 91,558 89,747 79,163
Europe excluding Sweden 71,078 75,612 77,616
North America 61,266 50,234 47,854
South America 4,966 4,996 6,496
Asia 7,006 7,236 7,734
Other markets 3,348 3,427 4,033
Volvo Group total 239,222 231,252 222,896
Capital expenditures 2002 2003 2004
Sweden 3,701 2,629 3,690
Europe excluding Sweden 5,793 6,042 6,305
North America 2,261 2,442 1,835
South America 147 214 247
Asia 194 299 362
Other markets 141 55 44
Volvo Group total 12,237 11,681 12,483
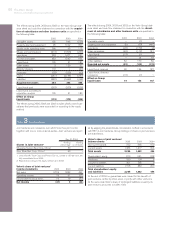
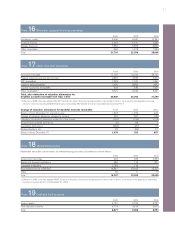
Note 5Other operating income and expenses
2002 2003 2004
Gains/losses on forward and options contracts (195) 1,243 828
Exchange rate differences on trade receivables and payables (266) (199) (86)
Amortization of goodwill (1,094) (873) (684)
Change in allowances for doubtful receivables, customer financing (1,018) (812) (545)
Change in allowances for doubtful receivables, other (362) (294) 37
Expenses for industrial relocation of Renault Trucks Villaverde plant in Spain – – (470)
Volvo profit sharing program – – (200)
Other income and expenses (1,217) (432) (165)
Total (4,152) (1,367) (1,285)
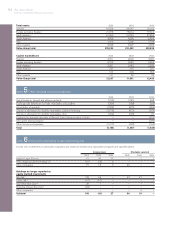
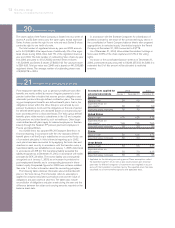
Note 6Income from investments in associated companies
Income from investments in associated companies and dividends received from associated companies are specified below:
Income (loss) Dividends received
2002 2003 2004 2002 2003 2004
Aviation Lease Finance 51 30 27 – – –
Petro Stopping Centers Holding LP (57) (73) 0 – – –
Other companies 77 15 0 20 – –
Holdings no longer reported as
equity method investments
Bilia AB 3128 64 – 44 47 –
Turbec AB 2(67) (77) – – – –
Xian Silver Bus Corp 429 – – –––
Shanghai Sunwin Bus Corp 4(23) – – – – –
Other companies – – – – 4 –
Subtotal 138 (41) 27 64 51 –