Volvo 2004 Annual Report Download - page 103
Download and view the complete annual report
Please find page 103 of the 2004 Volvo annual report below. You can navigate through the pages in the report by either clicking on the pages listed below, or by using the keyword search tool below to find specific information within the annual report.-
 1
1 -
2
-
3
-
4
-
5
-
6
-
7
-
8
-
9
-
10
-
11
-
12
-
13
-
14
-
15
-
16
-
17
-
18
-
19
-
20
-
21
-
22
-
23
-
24
-
25
-
26
-
27
-
28
-
29
-
30
-
31
-
32
-
33
-
34
-
35
-
36
-
37
-
38
-
39
-
40
-
41
-
42
-
43
-
44
-
45
-
46
-
47
-
48
-
49
-
50
-
51
-
52
-
53
-
54
-
55
-
56
-
57
-
58
-
59
-
60
-
61
-
62
-
63
-
64
-
65
-
66
-
67
-
68
-
69
-
70
-
71
-
72
-
73
-
74
-
75
-
76
-
77
-
78
-
79
-
80
-
81
-
82
-
83
-
84
-
85
-
86
-
87
-
88
-
89
-
90
-
91
-
92
-
 93
93 -
 94
94 -
 95
95 -
 96
96 -
 97
97 -
 98
98 -
 99
99 -
 100
100 -
 101
101 -
 102
102 -
 103
103 -
 104
104 -
 105
105 -
 106
106 -
 107
107 -
 108
108 -
 109
109 -
 110
110 -
 111
111 -
 112
112 -
 113
113 -
114
-
115
-
116
-
117
-
118
-
119
-
120
-
121
-
122
-
123
-
124
-
125
-
126
-
127
-
128
 |
 |

101
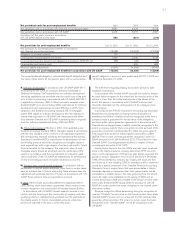
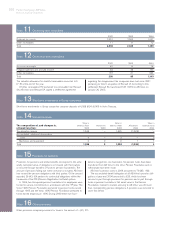
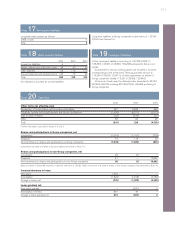
Note 19Contingent liabilities
Of the contingent liabilities amounting to 120,738 (128,411;
133,330), 120,591 (128,399; 133,298) pertained to Group com-
panies.
Guarantees for various credit programs are included in amounts
corresponding to the credit limits. These guarantees amount to
115,266 (123,503; 129,471), of which guarantees on behalf of
Group companies totaled 115,261 (123,498; 129,446).
At the end of each year, the utilized portion amounted to 53,142
(67,603; 69,672) including 53,130 (67,591; 69,640) pertaining to
Group companies.
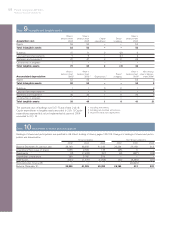
Note 18 Other current liabilities
2002 2003 2004
Income tax liabilities 6 – –
Wages, salaries and withholding taxes 38 39 53
Other liabilities 93 110 170
Accrued expenses and prepaid income 146 70 90
Total 283 219 313
No collateral is provided for current liabilities.
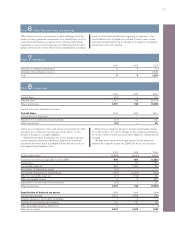
Note 17 Non-current liabilities
Long-term debt matures as follows:
2008 or later 6
Total 6
Long-term liabilities to Group companies include loans of – (3,180;
3,204) from Renault V.I.
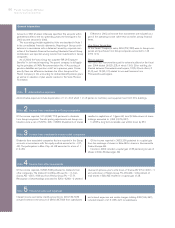
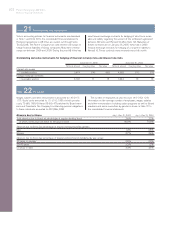
Note 20 Cash flow
2002 2003 2004
Other items not affecting cash
Revaluation of shareholdings and long-term receivables 557 6,555 545
Dividends, transfer pricing adjustments and Group contributions (1,408) (6,017) (5,273)
Gain on sale of shares (32) (310) (27)
Other 68 60 29
Total (815) 288 (4,726)
Further information is provided in Notes 2, 3 and 4.
Shares and participations in Group companies, net
Investments (1,616) (1,151) (703)
Disposals 72 118 33
Net investments in shares and participations in Group companies (1,544) (1,033) (670)
Investments and sales of shares in Group companies are shown in Note 10.
Shares and participations in non-Group companies, net
Investments 25 (1) –
Disposals 41 – 15,082
Net investments in shares and participations in non-Group companies 66 (1) 15,082
Sales of shares in Scania AB resulted in a positive cash flow of 15,029. Other investments and sales of shares in non-Group companies are presented in Note 10.
Increase/decrease in loans
New loans 1,054 – –
Amortization (1,829) (1,078) (3,180)
Change in loans, net (775) (1,078) (3,180)
Loans granted, net
New loans granted – (631) 0
Amortization received 891 40 –
Change in loans granted, net 891 (591) 0