Volvo 2004 Annual Report Download - page 27
Download and view the complete annual report
Please find page 27 of the 2004 Volvo annual report below. You can navigate through the pages in the report by either clicking on the pages listed below, or by using the keyword search tool below to find specific information within the annual report.-
 1
1 -
2
-
3
-
4
-
5
-
6
-
7
-
8
-
9
-
10
-
11
-
12
-
13
-
14
-
15
-
16
-
 17
17 -
 18
18 -
 19
19 -
 20
20 -
 21
21 -
 22
22 -
 23
23 -
 24
24 -
 25
25 -
 26
26 -
 27
27 -
 28
28 -
 29
29 -
 30
30 -
 31
31 -
 32
32 -
 33
33 -
 34
34 -
 35
35 -
 36
36 -
 37
37 -
38
-
39
-
40
-
41
-
42
-
43
-
44
-
45
-
46
-
47
-
48
-
49
-
50
-
51
-
52
-
53
-
54
-
55
-
56
-
57
-
58
-
59
-
60
-
61
-
62
-
63
-
64
-
65
-
66
-
67
-
68
-
69
-
70
-
71
-
72
-
73
-
74
-
75
-
76
-
77
-
78
-
79
-
80
-
81
-
82
-
83
-
84
-
85
-
86
-
87
-
88
-
89
-
90
-
91
-
92
-
93
-
94
-
95
-
96
-
97
-
98
-
99
-
100
-
101
-
102
-
103
-
104
-
105
-
106
-
107
-
108
-
109
-
110
-
111
-
112
-
113
-
114
-
115
-
116
-
117
-
118
-
119
-
120
-
121
-
122
-
123
-
124
-
125
-
126
-
127
-
128
 |
 |

25
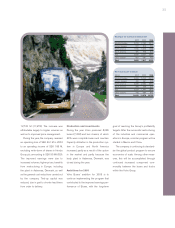
12,722 M (11,978). The increase was
attributable largely to higher volumes as
well as to improved price management.
During the year, the company reversed
an operating loss of SEK 361 M in 2003
to an operating income of SEK 185 M,
excluding write-down of shares in Henlys
Group plc. amounting to SEK 95 M (429).
The improved earnings were due to
increased volumes, higher prices, benefits
from restructuring in Europe, including
the plant in Aabenraa, Denmark, as well
as the general cost reductions carried out
by the company. Tied-up capital was
reduced, due in part to shorter lead times
from order to delivery.
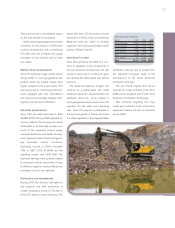
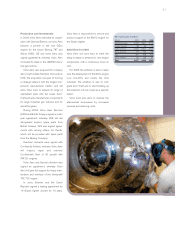
Production and investments
During the year Volvo produced 8,089
buses (7,223) and bus chassis, of which
34% were complete buses and coaches.
Capacity utilization in the production sys-
tem in Europe and North America
increased, partly as a result of the upturn
in the market and partly because the
body plant in Aabenraa, Denmark, was
closed during the year.
Ambitions for 2005
Volvo Buses’ ambition for 2005 is to
continue implementing the program that
contributed to the improved earnings per-
formance of Buses, with the long-term
goal of reaching the Group's profitability
targets. After the successful restructuring
of the industrial and commercial oper-
ations in Europe, a similar program will be
started in Mexico and China.
The company is continuing to standard-
ize the global product program to secure
economies of scale. Among other meas-
ures, this will be accomplished through
continued increased component com-
monality between the buses and trucks
within the Volvo Group.
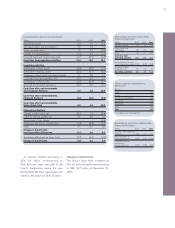
Number of vehicles delivered
2002 2003 2004
Western Europe 3,076 2,782 3,073
Eastern Europe 337 305 344
North America 1,945 1,553 1,388
South America 495 369 624
Asia 2,639 2,227 2,341
Other markets 567 581 462
Total 9,059 7,817 8,232
Net sales per market
SEKM 2002 2003 2004
Western Europe 6,695 6,153 6,422
Eastern Europe 409 381 526
North America 3,838 2,984 2,960
South America 366 329 521
Asia 2,022 1,447 1,632
Other markets 705 684 661
Total 14,035 11,978 12,722