Volvo 2004 Annual Report Download - page 68
Download and view the complete annual report
Please find page 68 of the 2004 Volvo annual report below. You can navigate through the pages in the report by either clicking on the pages listed below, or by using the keyword search tool below to find specific information within the annual report.-
 1
1 -
2
-
3
-
4
-
5
-
6
-
7
-
8
-
9
-
10
-
11
-
12
-
13
-
14
-
15
-
16
-
17
-
18
-
19
-
20
-
21
-
22
-
23
-
24
-
25
-
26
-
27
-
28
-
29
-
30
-
31
-
32
-
33
-
34
-
35
-
36
-
37
-
38
-
39
-
40
-
41
-
42
-
43
-
44
-
45
-
46
-
47
-
48
-
49
-
50
-
51
-
52
-
53
-
54
-
55
-
56
-
57
-
 58
58 -
 59
59 -
 60
60 -
 61
61 -
 62
62 -
 63
63 -
 64
64 -
 65
65 -
 66
66 -
 67
67 -
 68
68 -
 69
69 -
 70
70 -
 71
71 -
 72
72 -
 73
73 -
 74
74 -
 75
75 -
 76
76 -
 77
77 -
 78
78 -
79
-
80
-
81
-
82
-
83
-
84
-
85
-
86
-
87
-
88
-
89
-
90
-
91
-
92
-
93
-
94
-
95
-
96
-
97
-
98
-
99
-
100
-
101
-
102
-
103
-
104
-
105
-
106
-
107
-
108
-
109
-
110
-
111
-
112
-
113
-
114
-
115
-
116
-
117
-
118
-
119
-
120
-
121
-
122
-
123
-
124
-
125
-
126
-
127
-
128
 |
 |

66 The Volvo Group
Notes to consolidated financial statements
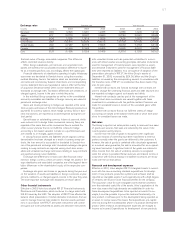
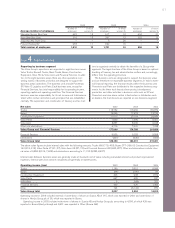
Note 8Other financial income and expenses
Other financial income and expenses in 2004 include a write-down of 1,196, pertaining to the restructuring of Henlys Group plc. The net
amount of exchange losses were 1 (gain 31; losses 55).
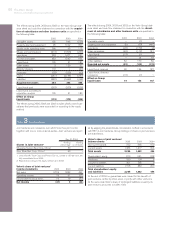
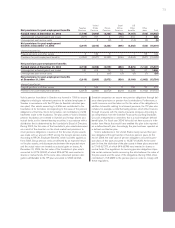
Note 9Income taxes
Income taxes were distributed as follows:
2002 2003 2004
Current taxes relating to the period (802) (984) (1,854)
Adjustment of current taxes for prior periods 156 (291) 288
Deferred taxes originated or reversed during the period (121) (831) (1,712)
Recognition and derecognition of deferred tax assets 242 802 99
Income taxes relating to associated companies (65) (30) (5)
Total income taxes (590) (1,334) (3,184)
Provisions have been made for estimated tax charges that may arise
as a result of prior tax audits in the Volvo Group. Tax claims for which
no provision has been deemed necessary of approximately 1,433
(1,098; 982) were reported as contingent liabilities.
Deferred taxes relate to income taxes payable or recoverable in
future periods in respect of taxable temporary differences, deductible
temporary differences, unused tax loss carryforwards or unused tax
credit carryforwards. Deferred tax assets are recognized to the
extent that it is probable that the amount can be utilized against
future taxable income. At December 31, 2004, the valuation
allowance attributable to deductible temporary differences, unused
tax loss carryforwards and unused tax credit carryforwards for which
no deferred tax asset was recognized amounted to 2,592 (2,718;
3,063).
At year-end 2004, the Group had unused tax loss carryforwards
of about 10,100, of which approximately 1,900 will expire within
5years.
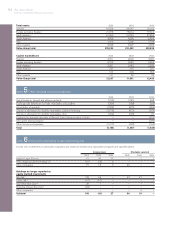
The Swedish corporate income tax rate is 28%. The table below
shows the principal reasons for the difference between this rate and
the Group’s tax rate, based on income after financial items.
2002, % 2003, % 2004, %
Swedish corporate income tax rates 28 28 28
Difference in tax rate in various countries 8 11 3
Capital gains (2) (2) (3)
Other non-taxable income (15) (23) (3)
Amortization of goodwill 16 13 1
Other non-deductible expenses 14 83 2
Adjustment of current taxes for prior years (8) 18 (2)
Recognition and derecognition of deferred tax assets (12) (48) (1)
Other, net 010
Income tax rate for the Group 29 81 25