Volvo 2004 Annual Report Download - page 78
Download and view the complete annual report
Please find page 78 of the 2004 Volvo annual report below. You can navigate through the pages in the report by either clicking on the pages listed below, or by using the keyword search tool below to find specific information within the annual report.
76 The Volvo Group
Notes to consolidated financial statements
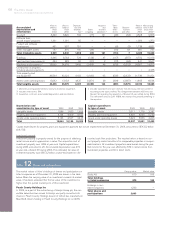
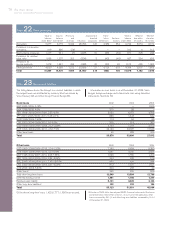
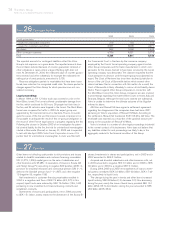
Note 22Other provisions
Value in Value in Provisions Acquired and Trans- Value in Whereof Whereof
balance balance and divested lation Reclassi- balance due within due after
sheet 2002 sheet 2003 reversals Utilization companies differences fications sheet 2004 12 months 12 months
Warranties 5,977 6,175 5,922 (5,659) 145 (195) 354 6,742 3,572 3,170
Provisions in insurance
operations 419 386 (74) ––––3120312
Restructuring measures 1,417 941 (7) (297) 19 (23) (62) 571 325 246
Provisions for residual
value risks 1,698 1,207 202 (336) 3 (43) (46) 987 354 633
Provisions for
service contracts 1,478 1,481 294 (288) 25 (20) 20 1,512 430 1,082
Other provisions 4,820 4,289 1,272 (1,580) 27 (172) 518 4,354 2,501 1,853
Total 15,809 14,479 7,609 (8,160) 219 (453) 784 14,478 7,182 7,296
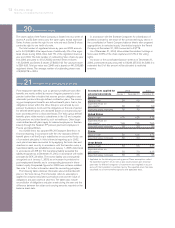
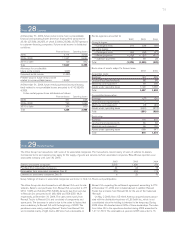
Other loans 2002 2003 2004
USD 1989–2004/2006–2015, 2.74–13.0% 7,280 5,634 5,360
EUR 1986–2004/2006–2013, 0.5–9.59% 1,841 3,245 2,596
GBP 1995-2004/2007–2010, 4.95-7.58% 1,028 1,786 1,269
SEK 1992–2004/2006–2016, 2.84–5.96% 224 349 519
BRL 2000–2004/2006–2011, 7.45–18.05% 435 626 944
CAD 2002–2004/2008–2010, 3.37–3.53% 972 1,527 1,557
AUD 2004–2008, 5.89% 400 208 49
Other loans1369 209 505
Total other long-term loans 12,549 13,584 12,799
Deferred leasing income 1,481 1,186 1,377
Residual value liability 5,121 3,249 3,122
Other long-term liabilities1102 192 154
Total 53,123 51,301 45,064
Of the above long-term loans, 1,422 (1,777; 1,358) was secured.
Note 23Non-current liabilities
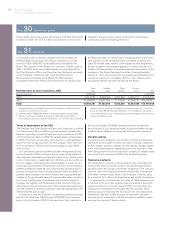
Bond loans 2002 2003 2004
GBP 2004/2006, 5.18% — — 1,905
DKK 1998/2005, 4.0% 310 58 —
SEK 1998–2004/2006–2009, 2.35–6.0% 5,950 6,372 4,798
JPY 2001–2003/2006–2011, 0.45–2.1% 888 1,443 542
HKD 1999/2006, 7.99% 113 94 85
CZK 2001/2004–2006/2010, 2.6–6.5% 306 514 380
USD 1998–2004/2006–2008, 2.22–2.89% 2,154 1,274 2,150
EUR 1996–2004/2006–2011, 2.32–7.0% 24,120 23,047 17,546
Other bond loans 29 288 206
Total 33,870 33,090 27,612
The listing below shows the Group’s non-current liabilities in which
the largest loans are distributed by currency. Most are issued by
Volvo Treasury AB and Volvo Group Finance Europe BV.
Information on loan terms is as of December 31, 2004. Volvo
hedges foreign-exchange and interest-rate risks using derivative
instruments. See Note 33.
1 Effective in 2003, Volvo has adopted RR27, Financial instruments; Disclosure
and presentation. See further in Note 1. As a result of the application, other
loans increased by 241 (–) and other long-term liabilities increased by 15 (–)
at December 31, 2004.


