Volvo 2004 Annual Report Download - page 63
Download and view the complete annual report
Please find page 63 of the 2004 Volvo annual report below. You can navigate through the pages in the report by either clicking on the pages listed below, or by using the keyword search tool below to find specific information within the annual report.-
 1
1 -
2
-
3
-
4
-
5
-
6
-
7
-
8
-
9
-
10
-
11
-
12
-
13
-
14
-
15
-
16
-
17
-
18
-
19
-
20
-
21
-
22
-
23
-
24
-
25
-
26
-
27
-
28
-
29
-
30
-
31
-
32
-
33
-
34
-
35
-
36
-
37
-
38
-
39
-
40
-
41
-
42
-
43
-
44
-
45
-
46
-
47
-
48
-
49
-
50
-
51
-
52
-
 53
53 -
 54
54 -
 55
55 -
 56
56 -
 57
57 -
 58
58 -
 59
59 -
 60
60 -
 61
61 -
 62
62 -
 63
63 -
 64
64 -
 65
65 -
 66
66 -
 67
67 -
 68
68 -
 69
69 -
 70
70 -
 71
71 -
 72
72 -
 73
73 -
74
-
75
-
76
-
77
-
78
-
79
-
80
-
81
-
82
-
83
-
84
-
85
-
86
-
87
-
88
-
89
-
90
-
91
-
92
-
93
-
94
-
95
-
96
-
97
-
98
-
99
-
100
-
101
-
102
-
103
-
104
-
105
-
106
-
107
-
108
-
109
-
110
-
111
-
112
-
113
-
114
-
115
-
116
-
117
-
118
-
119
-
120
-
121
-
122
-
123
-
124
-
125
-
126
-
127
-
128
 |
 |

61
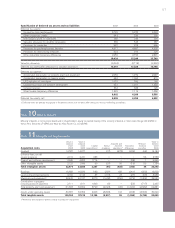
Note 4Segment reporting
2002 2003 2004
Number of of which Number of of which Number of of which
Average number of employees employees women, % employees women, % employees women, %
Shanghai Sunwin Bus Corp. 622 13 617 13 604 21
Xian Silver Bus Corp. 210 13 267 13 252 12
Jinan Hua Wo Truck Corp. – – 5 20 – –
Prévost Holding BV 978 11 842 15 – –
Total number of employees 1,810 12 1,731 14 856 18
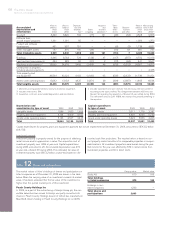
Reporting by business segment
The Volvo Group’s operations are organized in eight business areas:
Volvo Trucks, Renault Trucks, Mack Trucks, Buses, Construction
Equipment, Volvo Penta, Volvo Aero and Financial Services. In addi-
tion to the eight business areas, there are other operations con-
sisting mainly of business units that are designed to support the
business areas’ operations. The business units include Powertrain,
3P, Volvo IT, Logistics and Parts. Each business area, except for
Financial Services, has total responsibility for its operating income,
operating capital and operating cash flow. The Financial Services
business area has responsibility for its net income and total balance
sheet within certain restrictions and principles that are established
centrally. The supervision and coordination of treasury and tax mat-
ters is organized centrally to obtain the benefits of a Group-wide
approach. The legal structure of the Volvo Group is based on optimal
handling of treasury, tax and administrative matters and, accordingly,
differs from the operating structure.
The business units are designated to support the business areas
and are therefore not reportable business segments. In Volvo’s exter-
nal financial reporting, the financial results within the business units
Powertrain and Parts are distributed to the respective business seg-
ments. As the three truck brands share product development,
production and other activities in business units such as 3P and
Powertrain and also share certain infrastructure in distribution such
as dealers, the truck brands are reported as one business segment.
Net sales 2002 2003 2004
Trucks 118,752 116,969 136,879
Buses 14,035 11,978 12,722
Construction Equipment 21,012 23,154 28,685
Volvo Penta 7,669 7,596 9,057
Volvo Aero 8,837 8,030 6,925
Other and eliminations 6,775 7,041 7,228
Volvo Group excl Financial Services 177,080 174,768 201,496
Financial Services 9,925 9,153 9,598
Eliminations (807) (630) (693)
Volvo Group total 186,198 183,291 210,401
The above sales figures include internal sales with the following amounts: Trucks 690 (719; 400), Buses 377 (166; 0), Construction Equipment
162 (313; 318), Volvo Penta 27 (31; 27), Volvo Aero 43 (87; 74) and Financial Services 693 (630; 807). Other and eliminations include inter-
nal sales of 9,853 (8,014; 7,638) and eliminations amounting to 11,152 (9,330; 8,457).
Internal sales between business areas are generally made at standard cost of sales, including calculated interest and product improvement
expenses. Internal sales from service companies are generally at market prices.
Operating income (loss) 2002 2003 2004
Trucks 1,189 3,951 8,989
Buses (94) (790) 90
Construction Equipment 406 908 1,572
Volvo Penta 647 695 937
Volvo Aero 5(44)377
Financial Services 490 926 1,365
Other 194 (3,142) 870
Volvo Group total 2,837 2,504 14,200
Operating income in 2004 included reversal of write-down of shares in Scania AB of 915, which was reported in Other and write-down of
shares in Henlys Group plc of 95, which was reported in Buses.
Operating income in 2003 included write-down of shares in Scania AB and Henlys Group plc amounting to 4,030, of which 429 was
reported in Buses (Henlys Group) and 3,601 was reported in Other (Scania AB).