Volvo 2004 Annual Report Download - page 115
Download and view the complete annual report
Please find page 115 of the 2004 Volvo annual report below. You can navigate through the pages in the report by either clicking on the pages listed below, or by using the keyword search tool below to find specific information within the annual report.-
 1
1 -
2
-
3
-
4
-
5
-
6
-
7
-
8
-
9
-
10
-
11
-
12
-
13
-
14
-
15
-
16
-
17
-
18
-
19
-
20
-
21
-
22
-
23
-
24
-
25
-
26
-
27
-
28
-
29
-
30
-
31
-
32
-
33
-
34
-
35
-
36
-
37
-
38
-
39
-
40
-
41
-
42
-
43
-
44
-
45
-
46
-
47
-
48
-
49
-
50
-
51
-
52
-
53
-
54
-
55
-
56
-
57
-
58
-
59
-
60
-
61
-
62
-
63
-
64
-
65
-
66
-
67
-
68
-
69
-
70
-
71
-
72
-
73
-
74
-
75
-
76
-
77
-
78
-
79
-
80
-
81
-
82
-
83
-
84
-
85
-
86
-
87
-
88
-
89
-
90
-
91
-
92
-
93
-
94
-
95
-
96
-
97
-
98
-
99
-
100
-
101
-
102
-
103
-
104
-
 105
105 -
 106
106 -
 107
107 -
 108
108 -
 109
109 -
 110
110 -
 111
111 -
 112
112 -
 113
113 -
 114
114 -
 115
115 -
 116
116 -
 117
117 -
 118
118 -
 119
119 -
 120
120 -
 121
121 -
 122
122 -
 123
123 -
 124
124 -
 125
125 -
126
-
127
-
128
 |
 |

113
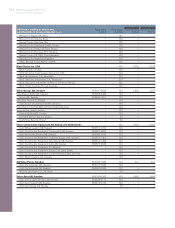
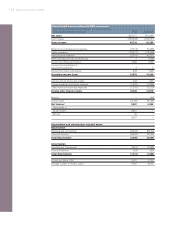
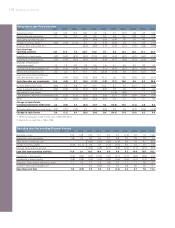
Consolidated balance sheets Volvo Group, excl
January 1 Financial Services1Financial Services Total Volvo Group
Dec 31 IAS 39 Jan 1 Dec 31 IAS 39 Jan 1 Dec 31 IAS 39 Jan 1
SEK M 2004 adjustm. 2005 2004 adjustm. 2005 2004 adjustm. 2005
Assets
Intangible assets 17,570 17,570 42 42 17,612 17,612
Property, plant and equipment 27,260 27,260 3,891 3,891 31,151 31,151
Assets under operating leases 8,477 8,477 773 773 19,534 19,534
Shares and participations 10,116 (494) 9,622 193 193 2,003 (494) 1,509
Long-term customer finance receivables 147 424 571 33,887 611 34,498 25,187 1,035 26,222
Long-term interest-bearing receivables 1,797 1,797 5 5 1,741 1,741
Other long-term receivables 6,492 985 7,477 212 212 6,100 988 7,088
Inventories 28,291 28,291 307 307 28,598 28,598
Short-term customer finance receivables 83 430 513 29,531 298 29,829 26,006 727 26,733
Short-term interest bearing receivables 10,330 10,330 0 0 1,643 1,643
Other short-term receivables 30,043 4,040 34,083 1,628 1,628 29,647 1,690 31,337
Marketable securities 25,839 25,839 116 116 25,955 25,955
Cash and bank 8,789 8,789 914 914 8,791 8,791
Total assets 175,234 5,385 180,619 71,499 909 72,408 223,968 3,946 227,914
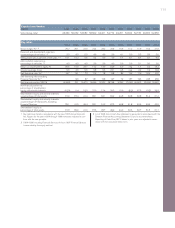
Shareholders’ equity and liabilities
Shareholders’ equity 70,155 348 70,503 8,306 8,306 70,155 348 70,503
Minority interests 0 0 0 0 0 0
Provisions for post-employment benefits 14,677 14,677 26 26 14,703 14,703
Other provisions 14,115 439 14,554 845 (6) 839 14,993 432 15,425
Loans 13,968 3,340 17,308 57,860 915 58,775 61,807 1,908 63,715
Other liabilities 62,319 1,258 63,577 4,462 4,462 62,310 1,258 63,568
Shareholders’ equity and liabilities 175,234 5,385 180,619 71,499 909 72,408 223,968 3,946 227,914
1 Financial Services reported in accordance with the equity method.
This table shows the expected impact of the adoption of IAS 39 that
should be prospectively applied from January 1, 2005. The IFRS bal-
ance including IAS 39 effects will be used as opening balance for
cash flow calculation during 2005.