Volvo 2004 Annual Report Download - page 100
Download and view the complete annual report
Please find page 100 of the 2004 Volvo annual report below. You can navigate through the pages in the report by either clicking on the pages listed below, or by using the keyword search tool below to find specific information within the annual report.-
 1
1 -
2
-
3
-
4
-
5
-
6
-
7
-
8
-
9
-
10
-
11
-
12
-
13
-
14
-
15
-
16
-
17
-
18
-
19
-
20
-
21
-
22
-
23
-
24
-
25
-
26
-
27
-
28
-
29
-
30
-
31
-
32
-
33
-
34
-
35
-
36
-
37
-
38
-
39
-
40
-
41
-
42
-
43
-
44
-
45
-
46
-
47
-
48
-
49
-
50
-
51
-
52
-
53
-
54
-
55
-
56
-
57
-
58
-
59
-
60
-
61
-
62
-
63
-
64
-
65
-
66
-
67
-
68
-
69
-
70
-
71
-
72
-
73
-
74
-
75
-
76
-
77
-
78
-
79
-
80
-
81
-
82
-
83
-
84
-
85
-
86
-
87
-
88
-
89
-
 90
90 -
 91
91 -
 92
92 -
 93
93 -
 94
94 -
 95
95 -
 96
96 -
 97
97 -
 98
98 -
 99
99 -
 100
100 -
 101
101 -
 102
102 -
 103
103 -
 104
104 -
 105
105 -
 106
106 -
 107
107 -
 108
108 -
 109
109 -
 110
110 -
111
-
112
-
113
-
114
-
115
-
116
-
117
-
118
-
119
-
120
-
121
-
122
-
123
-
124
-
125
-
126
-
127
-
128
 |
 |
98 Parent Company AB Volvo
Notes to financial statements
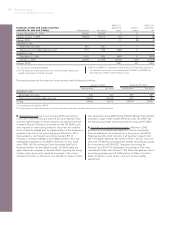
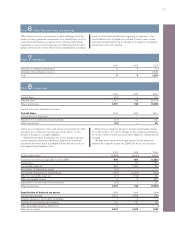
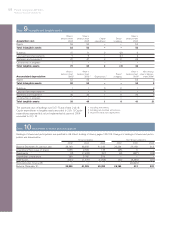
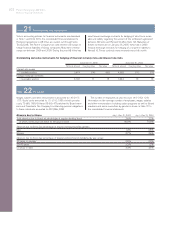
Note 9Intangible and tangible assets
Value in Value in Value in
balance sheet balance sheet Capital Sales/ balance sheet
Acquisition cost 2002 2003 expenditures scrapping 2004
Rights 52 52 — – 52
Total intangible assets 52 52 – – 52
Buildings 15 11 0 (2) 9
Land and land improvements 7 5 – (1) 4
Machinery and equipment 47 47 2 0 49
Construction in progress 1––––
Total tangible assets 70 63 2 (3) 62
Value in Value in Value in Net carrying
balance sheet balance sheet Sales/ balance sheet value in balance
Accumulated depreciation 2002 22003 2Depreciation 1scrapping 20042sheet 20043
Rights 52 52 – – 52 0
Total intangible assets 52 52 – – 52 0
Buildings 110018
Land and land improvements – – 0 – – 4
Machinery and equipment 38 39 1 0 40 9
Construction in progress ––––––
Total tangible assets 39 40 1 0 41 21
The assessed value of buildings was 5 (7; 7) and of land 2 (3; 4).
Capital expenditures in tangible assets amounted to 2 (0; 1). Capital
expenditures approved but not yet implemented at year-end 2004
amounted to 0 (1; 2).
1 Including write-downs.
2 Including accumulated write-downs.
3 Acquisition value, less depreciation.
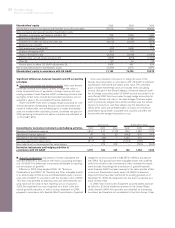
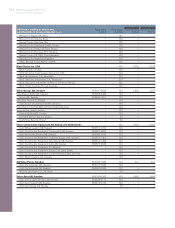
Note 10 Investments in shares and participations
Holdings of shares and participations are specified in AB Volvo’s holding of shares, pages 103-105. Changes in holdings of shares and partici-
pations are shown below.
Group companies Non-Group companies
2002 2003 2004 2002 2003 2004
Balance December 31, previous year 38,140 38,950 41,329 26,224 26,168 813
Acquisitions/New issue of shares 1,055 2,796 133 (25) 0 –
Divestments (3) (1,998) (81) (6) (587) (25)
Shareholder contributions 289 3,160 376 – – –
Write-downs (531) (1,579) (1,364) (25) (4,344) (97)
Reclassification, Scania AB ––––(20,424) –
Balance, December 31 38,950 41,329 40,393 26,168 813 691