Volvo 2004 Annual Report Download - page 96
Download and view the complete annual report
Please find page 96 of the 2004 Volvo annual report below. You can navigate through the pages in the report by either clicking on the pages listed below, or by using the keyword search tool below to find specific information within the annual report.-
 1
1 -
2
-
3
-
4
-
5
-
6
-
7
-
8
-
9
-
10
-
11
-
12
-
13
-
14
-
15
-
16
-
17
-
18
-
19
-
20
-
21
-
22
-
23
-
24
-
25
-
26
-
27
-
28
-
29
-
30
-
31
-
32
-
33
-
34
-
35
-
36
-
37
-
38
-
39
-
40
-
41
-
42
-
43
-
44
-
45
-
46
-
47
-
48
-
49
-
50
-
51
-
52
-
53
-
54
-
55
-
56
-
57
-
58
-
59
-
60
-
61
-
62
-
63
-
64
-
65
-
66
-
67
-
68
-
69
-
70
-
71
-
72
-
73
-
74
-
75
-
76
-
77
-
78
-
79
-
80
-
81
-
82
-
83
-
84
-
85
-
 86
86 -
 87
87 -
 88
88 -
 89
89 -
 90
90 -
 91
91 -
 92
92 -
 93
93 -
 94
94 -
 95
95 -
 96
96 -
 97
97 -
 98
98 -
 99
99 -
 100
100 -
 101
101 -
 102
102 -
 103
103 -
 104
104 -
 105
105 -
 106
106 -
107
-
108
-
109
-
110
-
111
-
112
-
113
-
114
-
115
-
116
-
117
-
118
-
119
-
120
-
121
-
122
-
123
-
124
-
125
-
126
-
127
-
128
 |
 |
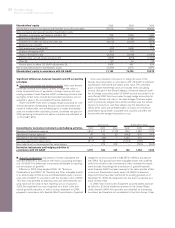
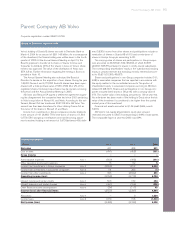
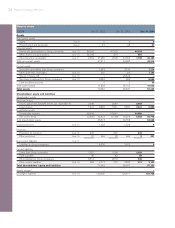
94 Parent Company AB Volvo
Balance sheets
SEK M Dec 31, 2002 Dec 31, 2003 Dec 31, 2004
Assets
Non-current assets
Rights Note 9 000
Property, plant and equipment Note 9 31 23 21
Financial assets
Shares and participations in Group companies Note 10 38,950 41,329 40,393
Other shares and participations Note 10 26,168 813 691
Other long-term receivables Note 11 2,362 67,480 2,520 44,662 1,109 42,193
Total non-current assets 67,511 44,685 42,214
Current assets
Short-term receivables from Group companies 2,543 3,729 7,274
Other short-term receivables Note 12 250 85 1,143
Shares in Scania AB Note 10 –20,424 –
Short-term investments in Group companies Note 13 9,045 924 6,558
Cash and bank accounts 0 0 50
Total current assets 11,838 25,162 15,025
Total assets 79,349 69,847 57,239
Shareholders’ equity and liabilities
Shareholders’ equity
Restricted equity
Share capital (441,520,885 shares, par value SEK 6) 2,649 2,649 2,649
Legal reserve 7,241 9,890 7,241 9,890 7,241 9,890
Unrestricted equity
Unrestricted reserves 58,908 53,067 38,680
Net income (loss) (2,485) 56,423 (2,189) 50,878 5,098 43,778
Total shareholders’ equity 66,313 60,768 53,668
Untaxed reserves Note 14 1,528 1,528 4
Provisions
Provisions for pensions Note 15 425 437 419
Other provisions Note 16 41 466 29 466 2421
Non-current liabilities Note 17
Liabilities to Group companies 4,330 3,252 6
Current liabilities
Loans from Group companies 1,081 1,054 2,020
Trade payables 36 42 58
Other liabilities to Group companies 5,312 2,518 749
Other current liabilities Note 18 283 6,712 219 3,833 313 3,140
Total shareholders’ equity and liabilities 79,349 69,847 57,239
Assets pledged – – –
Contingent liabilities Note 19 133,330 128,411 120,738