Volvo 2004 Annual Report Download - page 24
Download and view the complete annual report
Please find page 24 of the 2004 Volvo annual report below. You can navigate through the pages in the report by either clicking on the pages listed below, or by using the keyword search tool below to find specific information within the annual report.-
 1
1 -
2
-
3
-
4
-
5
-
6
-
7
-
8
-
9
-
10
-
11
-
12
-
13
-
 14
14 -
 15
15 -
 16
16 -
 17
17 -
 18
18 -
 19
19 -
 20
20 -
 21
21 -
 22
22 -
 23
23 -
 24
24 -
 25
25 -
 26
26 -
 27
27 -
 28
28 -
 29
29 -
 30
30 -
 31
31 -
 32
32 -
 33
33 -
 34
34 -
35
-
36
-
37
-
38
-
39
-
40
-
41
-
42
-
43
-
44
-
45
-
46
-
47
-
48
-
49
-
50
-
51
-
52
-
53
-
54
-
55
-
56
-
57
-
58
-
59
-
60
-
61
-
62
-
63
-
64
-
65
-
66
-
67
-
68
-
69
-
70
-
71
-
72
-
73
-
74
-
75
-
76
-
77
-
78
-
79
-
80
-
81
-
82
-
83
-
84
-
85
-
86
-
87
-
88
-
89
-
90
-
91
-
92
-
93
-
94
-
95
-
96
-
97
-
98
-
99
-
100
-
101
-
102
-
103
-
104
-
105
-
106
-
107
-
108
-
109
-
110
-
111
-
112
-
113
-
114
-
115
-
116
-
117
-
118
-
119
-
120
-
121
-
122
-
123
-
124
-
125
-
126
-
127
-
128
 |
 |
Business environment
There were no significant changes to the
structure of the truck industry during
2004 in terms of mergers or acquisitions.
The year was characterized by a
synchronized global recovery in demand,
which was particularly strong in North
America and the Middle East. The
increased demand led to a significant
increase of truck production, with only
moderate investments in new production
capacity among OEMs and suppliers.
During 2004 the truck industry en-
countered sporadic supply bottlenecks of
components and parts, as the suppliers
had to accelerate their production sys-
tems very quickly to respond to significant
increases in production rates.
One factor putting pressure on the
industry was the increased costs on raw
materials, to which the industry responded
by increasing efficiency and adjusting
prices.
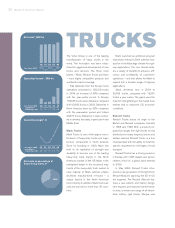
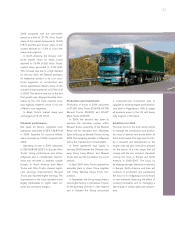
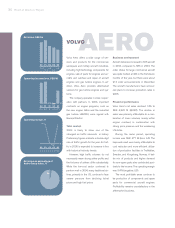
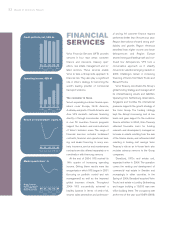
Market share development
The Group’s combined market share for
heavy trucks in Europe 27 was 26.5% in
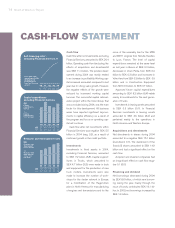
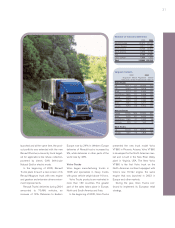
During 2004, Volvo Trucks delivered a
total of 97,264 trucks, an increase of
29% compared with a year earlier.
Deliveries increased by 52% in North
America, by 45% in Asia and by 43% in
South America. The strong development
in Asia was mainly based on high deliver-
ies to the Middle East.
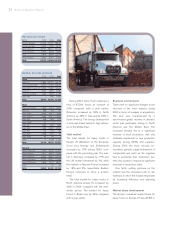
Total market
The total market for heavy trucks in
Europe 27 (Members of the European
Union plus Norway and Switzerland)
increased by 12% during 2004, com-
pared with the preceding year. The mar-
ket in Germany increased by 17% and
the UK market decreased by 1%, while
the markets in Italy and France increased
by 18% and 5%, respectively. Eastern
Europe continues to show a positive
trend.
The total market for heavy trucks in
North America (Class 8) increased by
43% in 2004 compared with the year-
earlier period. The market for heavy
trucks in Brazil rose by 34% compared
with a year earlier.
22 Board of Directors’ Report
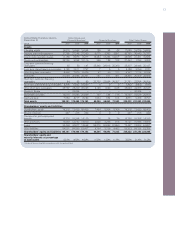
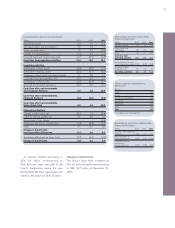
Net sales per market
SEKM 2002 2003 2004
Western Europe 61,406 63,097 68,664
Eastern Europe 6,424 7,004 8,767
North America 33,721 28,151 35,154
South America 3,277 3,464 5,223
Asia 5,919 9,206 12,378
Other markets 8,005 6,047 6,693
Total 118,752 116,969 136,879
Number of trucks produced
2002 2003 2004
Volvo
Volvo FH 31,880 33,720 45,010
Volvo VN and VHD 14,300 17,080 25,640
Volvo FM9, 10, and 12 15,300 17,480 18,900
Volvo FL 5,640 4,820 4,980
Volvo NL and NH 1,490 1,940 1,170
Volvo VM – 400 1,600
Total 68,610 75,440 97,300
Mack
Mack CH / CHN 7,540 1,744 2,006
Mack CL 288 64 170
Mack Vision 2,523 4,811 7,283
Mack Granite 4,592 6,217 10,935
Mack DM 528 458 519
Mack DMM 47 – –
Mack LE 1,084 964 849
Mack MR 1,668 2,034 2,603
Mack RB 103 130 130
Mack RD6 2,298 921 17
Mack RD8 35 54 4
Other – 1,122 1,121
Total 20,706 18,519 25,637
Renault
Renault Mascott 11,446 9,797 11,574
Renault Kerax 7,677 6,674 7,063
Renault Midlum 12,545 12,801 16,018
Renault Premium 16,150 15,567 17,250
Renault Magnum 7,848 7,516 8,801
SISU – 45 49
Total 55,666 52,400 60,755