Volvo 2004 Annual Report Download - page 88
Download and view the complete annual report
Please find page 88 of the 2004 Volvo annual report below. You can navigate through the pages in the report by either clicking on the pages listed below, or by using the keyword search tool below to find specific information within the annual report.-
 1
1 -
2
-
3
-
4
-
5
-
6
-
7
-
8
-
9
-
10
-
11
-
12
-
13
-
14
-
15
-
16
-
17
-
18
-
19
-
20
-
21
-
22
-
23
-
24
-
25
-
26
-
27
-
28
-
29
-
30
-
31
-
32
-
33
-
34
-
35
-
36
-
37
-
38
-
39
-
40
-
41
-
42
-
43
-
44
-
45
-
46
-
47
-
48
-
49
-
50
-
51
-
52
-
53
-
54
-
55
-
56
-
57
-
58
-
59
-
60
-
61
-
62
-
63
-
64
-
65
-
66
-
67
-
68
-
69
-
70
-
71
-
72
-
73
-
74
-
75
-
76
-
77
-
 78
78 -
 79
79 -
 80
80 -
 81
81 -
 82
82 -
 83
83 -
 84
84 -
 85
85 -
 86
86 -
 87
87 -
 88
88 -
 89
89 -
 90
90 -
 91
91 -
 92
92 -
 93
93 -
 94
94 -
 95
95 -
 96
96 -
 97
97 -
 98
98 -
99
-
100
-
101
-
102
-
103
-
104
-
105
-
106
-
107
-
108
-
109
-
110
-
111
-
112
-
113
-
114
-
115
-
116
-
117
-
118
-
119
-
120
-
121
-
122
-
123
-
124
-
125
-
126
-
127
-
128
 |
 |

86 The Volvo Group
Notes to consolidated financial statements
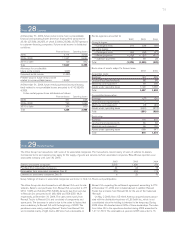
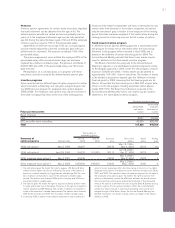
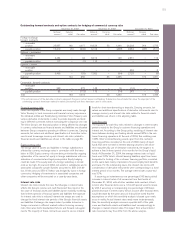
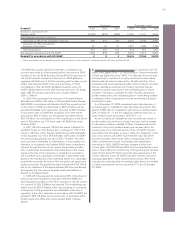
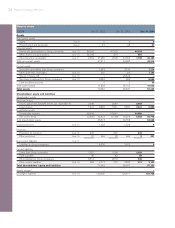
Outstanding derivate instruments for hedging of financial currency risks and interest rate risks
December 31, 2002 December 31, 2003 December 31, 2004
Notional Carrying Notional Carrying Notional Carrying
amount value Fair value amount value Fair value amount value Fair value
Interest-rate swaps
– receivable
position 78,571 2,822 4,404 90,428 3,253 4,662 76,667 1,659 2,919
– payable position 73,257 (1,568) (2,536) 93,400 (1,431) (2,266) 68,018 (1,585) (2,144)
Forwards and futures
– receivable
position 260,921 216 216 426,873 183 182 497,951 168 168
– payable position 255,503 (217) (220) 437,570 (193) (198) 499,512 (182) (182)
Foreign exchange
derivative contracts
– receivable
position 15,962 211 202 14,639 216 238 17,120 286 286
– payable position 5,443 (70) (72) 1,774 (67) (39) 8,273 (82) (107)
Options purchased,
caps and floors
– receivable
position – – – 291 – 15 – – –
– payable position 200 – (7) 200 – (5) 200 – (4)
Options written,
caps and floors
– receivable
position ––––––13300
– payable position ––––––1,946 (12) (12)
Total 1,394 1,987 1,961 2,589 252 924
Price risks
The exposure for price risks as a result of changes in interest rates
is attributable to financial assets and liabilities with extended fixed
interest rate terms. A comparison between carrying values and fair
values of Volvo’s all financial assets, liabilities and derivative instru-
ments is presented in the table on page 87.
Market risks attributable to investments in shares or other
equity instruments
The Volvo Group is exposed to market risks attributable to invest-
ments in shares or other equity instruments because funds that have
been transferred to Volvo’s pension plans partially are invested in
instruments of this nature. Additional information regarding plan
assets and obligations of Volvo’s pension plans is presented in Note
21. Apart from Volvo’s pension plans, investments in shares are only
made if motivated by operational purposes. A comparison between
carrying values and market values of Volvo’s holdings in listed com-
panies is included in Note 12.
Credit risks
Volvo’s granting of credits is governed by common policies and rules
for classification of customers. The credit portfolio should include a
proper distribution among different categories of customers and
industries. Credit risks are managed through active monitoring, follow-
up routines and in appropriate cases repossession of products.
Furthermore, it is continuously monitored that appropriate allowances
are made for doubtful receivables.
At December 31, 2004, the credit portfolio within Volvo’s cus-
tomer financing operations amounted to approximately SEK 64 bil-
lion. The credit risks within this portfolio are distributed among a
large number of individual customers and dealers. Collaterals exist in
the form of the products being financed. When granting credits, an
effort is made to balance risk exposure and expected yield.
The Volvo Group’s financial assets are primarily managed by Volvo
Treasury and invested in the money and capital markets. All invest-
ments must meet criteria for low credit risk and high liquidity. In
accordance with Volvo’s credit policy, counterparties for both invest-
ments and transactions in derivatives must in general have received
a rating of “A” or better from one of the well established credit-rating
agencies.
At the use of derivative instruments a counterparty risk will arise,
i.e. the risk that a counterparty will not fulfill its part of a contract and
that a potential gain will not be realized. Where appropriate, master
netting agreements are signed with the respective counterparties to
reduce exposure. The credit risk in futures contracts is limited
through daily or monthly cash settlements of the net change in value
of open contracts. The estimated gross exposure for counterparty
risks related to forward exchange contracts, interest rate swaps and
futures, options and commodity forward contracts amounted to
2,061; 3,087; 112 and 7 as of December 31, 2004.
Liquidity risks
Volvo maintains a strong financial position by continuously keeping a
certain percentage of sales in liquid assets. A proper balance
between short-term and long-term borrowing, as well as the ability to
borrow in the form of credit facilities, are designed to ensure long-
term financing.