Volvo 2004 Annual Report Download - page 17
Download and view the complete annual report
Please find page 17 of the 2004 Volvo annual report below. You can navigate through the pages in the report by either clicking on the pages listed below, or by using the keyword search tool below to find specific information within the annual report.-
 1
1 -
2
-
3
-
4
-
5
-
6
-
 7
7 -
 8
8 -
 9
9 -
 10
10 -
 11
11 -
 12
12 -
 13
13 -
 14
14 -
 15
15 -
 16
16 -
 17
17 -
 18
18 -
 19
19 -
 20
20 -
 21
21 -
 22
22 -
 23
23 -
 24
24 -
 25
25 -
 26
26 -
 27
27 -
28
-
29
-
30
-
31
-
32
-
33
-
34
-
35
-
36
-
37
-
38
-
39
-
40
-
41
-
42
-
43
-
44
-
45
-
46
-
47
-
48
-
49
-
50
-
51
-
52
-
53
-
54
-
55
-
56
-
57
-
58
-
59
-
60
-
61
-
62
-
63
-
64
-
65
-
66
-
67
-
68
-
69
-
70
-
71
-
72
-
73
-
74
-
75
-
76
-
77
-
78
-
79
-
80
-
81
-
82
-
83
-
84
-
85
-
86
-
87
-
88
-
89
-
90
-
91
-
92
-
93
-
94
-
95
-
96
-
97
-
98
-
99
-
100
-
101
-
102
-
103
-
104
-
105
-
106
-
107
-
108
-
109
-
110
-
111
-
112
-
113
-
114
-
115
-
116
-
117
-
118
-
119
-
120
-
121
-
122
-
123
-
124
-
125
-
126
-
127
-
128
 |
 |

15
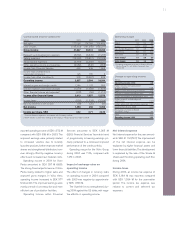
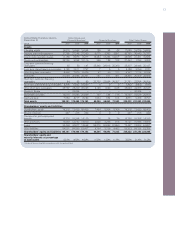
Consolidated cash-flow statements
SEKbn 2002 2003 2004
Operating income 2.3 1.6 12.8
Add depreciation and amortization 7.8 7.2 7.4
Other non-cash items 1.0 4.1 (0.4)
Change in working capital 0.4 0.7 (1.5)
Financial items and income taxes paid (1.1) (0.7) (0.2)
Cash flow from operating activities 10.4 12.9 18.1
Investing activities
Investments in fixed assets (6.3) (5.8) (7.2)
Investment in leasing assets (0.1) (0.1) (0.3)
Disposals of fixed assets and leasing assets 1.1 0.6 0.7
Customer Finance receivables, net 0.0 0.0 0.1
Investments in shares, net (0.1) (0.1) 15.1
Acquired and divested operations (0.1) 0.0 (0.1)
Cash flow after net investments
excl Financial Services 4.9 7.5 26.4
Cash flow after net investments,
Financial Services (4.3) (3.2) (5.5)
Cash flow after net investments,
Volvo Group total 0.6 4.3 20.9
Financing activities
Change in other loans, net (0.1) 1.9 (8.8)
Loans to external parties, net 1.7 0.9 0.0
Repurchase of own shares – – (2.5)
Dividend to AB Volvo's shareholders (3.4) (3.4) (3.4)
Other 0.1 0.1 0.0
Change in liquid funds
excl translation differences (1.1) 3.8 6.2
Translation differences on liquid funds (0.7) (0.6) (0.2)
Change in liquid funds (1.8) 3.2 6.0
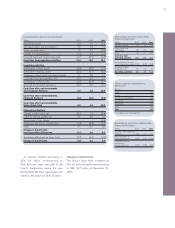
Operating cash flow, excluding
Financial Services
SEKbn 2002 2003 2004
Operating income 2.3 1.6 12.8
Depreciation and
amortization 7.8 7.2 7.4
Other 0.3 4.1 (2.1)
Cash flow from
operating activities 10.4 12.9 18.1
Net investments in fixed
assets and leasing assets (5.3) (5.3) (6.8)
Customer finance
receivables, net 0.0 0.0 0.1
Operating cash flow 5.1 7.6 11.4
Condensed cash-flow statements,
Financial Services
SEKbn 2002 2003 2004
Cash flow from operating
activities 4.9 4.1 5.1
Net investments in
credit portfolio, etc (9.2) (7.3) (10.6)
Cash flow after net
investments,
Financial Services (4.3) (3.2) (5.5)
Future capital expenditures,
approved1
SEK bn
Trucks 6.3
Buses 0.2
Construction Equipment 0.6
Volvo Penta 0.1
Volvo Aero 0.4
Other 0.6
Total 8.2
1In property, plant and equipment.
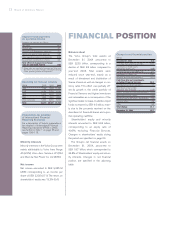
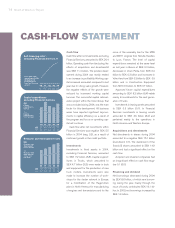
An ordinary dividend amounting to
SEK3.4 billion, corresponding to
SEK8.00 per share, was paid to AB
Volvo's shareholders during the year.
During 2004 AB Volvo repurchased own
shares to the amount of SEK 2.5 billion.
Change in liquid funds
The Group’s liquid funds increased by
SEK 6.0 billion during the year amounting
to SEK 34.7 billion at December 31,
2004.