Volvo 2004 Annual Report Download - page 117
Download and view the complete annual report
Please find page 117 of the 2004 Volvo annual report below. You can navigate through the pages in the report by either clicking on the pages listed below, or by using the keyword search tool below to find specific information within the annual report.-
 1
1 -
2
-
3
-
4
-
5
-
6
-
7
-
8
-
9
-
10
-
11
-
12
-
13
-
14
-
15
-
16
-
17
-
18
-
19
-
20
-
21
-
22
-
23
-
24
-
25
-
26
-
27
-
28
-
29
-
30
-
31
-
32
-
33
-
34
-
35
-
36
-
37
-
38
-
39
-
40
-
41
-
42
-
43
-
44
-
45
-
46
-
47
-
48
-
49
-
50
-
51
-
52
-
53
-
54
-
55
-
56
-
57
-
58
-
59
-
60
-
61
-
62
-
63
-
64
-
65
-
66
-
67
-
68
-
69
-
70
-
71
-
72
-
73
-
74
-
75
-
76
-
77
-
78
-
79
-
80
-
81
-
82
-
83
-
84
-
85
-
86
-
87
-
88
-
89
-
90
-
91
-
92
-
93
-
94
-
95
-
96
-
97
-
98
-
99
-
100
-
101
-
102
-
103
-
104
-
105
-
106
-
 107
107 -
 108
108 -
 109
109 -
 110
110 -
 111
111 -
 112
112 -
 113
113 -
 114
114 -
 115
115 -
 116
116 -
 117
117 -
 118
118 -
 119
119 -
 120
120 -
 121
121 -
 122
122 -
 123
123 -
 124
124 -
 125
125 -
 126
126 -
 127
127 -
128
 |
 |

115
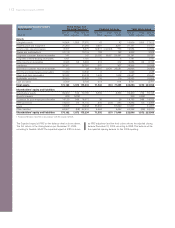
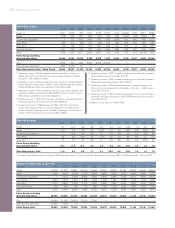
Key operating ratios
% of sales IFRS Sw GAAP
Gross margin 21.6 21.5
Research and development expenses 3.8 3.6
Selling expenses 9.1 9.0
Administrative expenses 2.6 2.6
Operating margin 7.3 7.0
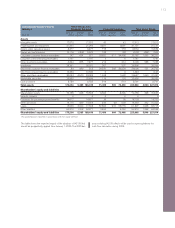
Net sales
SEK M IFRS Sw GAAP
Trucks 136,879 136,879
Buses 12,722 12,722
Construction Equipment129,360 28,685
Volvo Penta 9,057 9,057
Volvo Aero 6,925 6,925
Other 7,228 7,228
Net sales 202,171 201,496
1 Consolidation temporary investments, LB Smith, January–November.
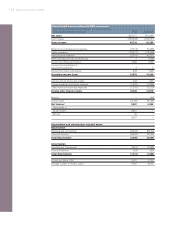
Operating income
SEK M IFRS Sw GAAP
Trucks 8,992 8,989
Buses 253 185
Construction Equipment 1,898 1,572
Volvo Penta 940 937
Volvo Aero 403 377
Volvo Financial Services 1,365 1,365
Other units 8 (45)
Operating income113,859 13,380
Revaluation of shares 820 820
Operating income (loss) 14,679 14,200
1 Excluding revaluation of shares in Scania AB and Henlys Group Plc.
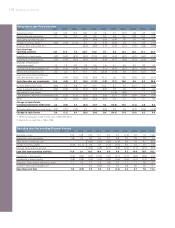
Operating margins
%IFRSSw GAAP
Trucks 6.6 6.6
Buses 2.0 1.5
Construction Equipment 6.5 5.5
Volvo Penta 10.4 10.3
Volvo Aero 5.8 5.4
Operating margin16.9 6.6
Operating margin 7.3 7.0
1 Excluding revaluation of shares in Scania AB and Henlys Group Plc.