Volvo 2004 Annual Report Download - page 118
Download and view the complete annual report
Please find page 118 of the 2004 Volvo annual report below. You can navigate through the pages in the report by either clicking on the pages listed below, or by using the keyword search tool below to find specific information within the annual report.-
 1
1 -
2
-
3
-
4
-
5
-
6
-
7
-
8
-
9
-
10
-
11
-
12
-
13
-
14
-
15
-
16
-
17
-
18
-
19
-
20
-
21
-
22
-
23
-
24
-
25
-
26
-
27
-
28
-
29
-
30
-
31
-
32
-
33
-
34
-
35
-
36
-
37
-
38
-
39
-
40
-
41
-
42
-
43
-
44
-
45
-
46
-
47
-
48
-
49
-
50
-
51
-
52
-
53
-
54
-
55
-
56
-
57
-
58
-
59
-
60
-
61
-
62
-
63
-
64
-
65
-
66
-
67
-
68
-
69
-
70
-
71
-
72
-
73
-
74
-
75
-
76
-
77
-
78
-
79
-
80
-
81
-
82
-
83
-
84
-
85
-
86
-
87
-
88
-
89
-
90
-
91
-
92
-
93
-
94
-
95
-
96
-
97
-
98
-
99
-
100
-
101
-
102
-
103
-
104
-
105
-
106
-
107
-
 108
108 -
 109
109 -
 110
110 -
 111
111 -
 112
112 -
 113
113 -
 114
114 -
 115
115 -
 116
116 -
 117
117 -
 118
118 -
 119
119 -
 120
120 -
 121
121 -
 122
122 -
 123
123 -
 124
124 -
 125
125 -
 126
126 -
 127
127 -
 128
128
 |
 |

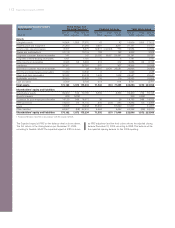
116 Eleven-year summary
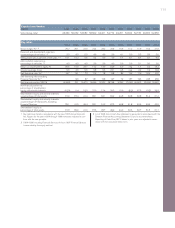
Eleven-year summary
Consolidated income statements
SEKM 1994 1995 1996 1997 1998 1999 2000 2001 2002 2003 2004
Net sales 155,866 171,511 156,060 183,625 212,936 125,019 130,070 189,280 186,198 183,291 210,401
Cost of sales (115,092) (128,529) (121,249) (138,990) (163,876) (99,501) (104,548) (155,592) (151,569) (146,879) (163,947)
Gross income 40,774 42,982 34,811 44,635 49,060 25,518 25,522 33,688 34,629 36,412 46,454
Research and development expenses (4,652) (7,343) (8,271) (8,659) (10,104) (4,525) (4,876) (5,391) (5,869) (6,829) (7,233)
Selling expenses (15,737) (17,418) (14,895) (17,160) (19,042) (8,865) (10,140) (15,766) (16,604) (16,866) (19,099)
Administrative expenses (7,711) (7,399) (6,685) (7,018) (8,091) (4,791) (4,974) (6,709) (5,658) (5,467) (5,494)
Other operating income and expenses (3,262) (1,657) (1,087) (3,141) (2,634) (611) 622 (4,096) (4,152) (1,367) (1,285)
Income (loss) from investments in
associated companies 5,861 2,119 314 2,929 444 567 444 50 182 200 27
Income from other investments 1,667 788 9,007 1,168 4,526 170 70 1,410 309 (3,579) 830
Income from divestment of subsidiaries – 3,032 – – – 26,695 – ––––
Restructuring costs – (1,817) – – (2,331) – – (3,862) – – –
Operating income (loss) 16,940 13,287 13,194 12,754 11,828 34,158 6,668 (676) 2,837 2,504 14,200
Interest income and similar credits 2,927 3,801 4,530 3,197 1,268 1,812 1,588 1,275 1,217 1,096 820
Interest expenses and similar charges (3,572) (3,686) (3,114) (2,699) (1,315) (1,505) (1,845) (2,274) (1,840) (1,888) (1,231)
Other financial income and expenses 83 (354) (407) (76) (162) 131 (165) (191) (201) (55) (1,210)
Income (loss) after
financial items 16,378 13,048 14,203 13,176 11,619 34,596 6,246 (1,866) 2,013 1,657 12,579
Income taxes (2,783) (3,741) (1,825) (2,583) (3,140) (2,270) (1,510) 326 (590) (1,334) (3,184)
Minority interests in net income (loss) (365) (45) 99 (112) (42) (104) (27) 73 (30) (25) (40)
Net income (loss) 13,230 9,262 12,477 10,481 8,437 32,222 4,709 (1,467) 1,393 298 9,355
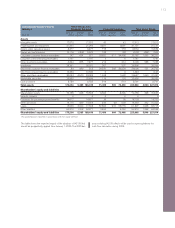
Consolidated income statements with Financial Services reported in accordance with the equity method
SEKM 1994 1995 1996 1997 1998 1999 2000 2001 2002 2003 2004
Net sales 154,668 166,541 150,425 178,531 205,712 116,382 120,392 180,615 177,080 174,768 201,496
Cost of sales (135,027) (158,077) (92,772) (97,131) (149,477) (145,453) (141,256) (158,231)
Gross income 43,504 47,635 23,610 23,261 31,138 31,627 33,512 43,265
Research and development expenses (8,659) (10,104) (4,525) (4,876) (5,391) (5,869) (6,829) (7,233)
Selling expenses (16,763) (18,468) (8,117) (9,285) (14,663) (15,393) (15,891) (18,048)
Administrative expenses (6,889) (7,950) (4,632) (4,651) (6,474) (5,464) (5,259) (5,321)
Other operating income and expenses (3,015) (2,515) (587) 309 (3,071) (2,989) (540) (658)
Income from Financial Services 375 681 1,066 1,499 325 490 926 1,365
Income (loss) from investments in
associated companies 3,033 354 478 341 (86) 126 166 2
Income from other investments 1,168 4,526 170 70 1,408 309 (3,581) 828
Income from divestment of subsidiaries – – 26,695 – ––––
Restructuring costs – (2,331) – – (3,862) – – –
Operating income (loss) 16,940 13,287 13,194 12,754 11,828 34,158 6,668 (676) 2,837 2,504 14,200