Volvo 2004 Annual Report Download - page 65
Download and view the complete annual report
Please find page 65 of the 2004 Volvo annual report below. You can navigate through the pages in the report by either clicking on the pages listed below, or by using the keyword search tool below to find specific information within the annual report.-
 1
1 -
2
-
3
-
4
-
5
-
6
-
7
-
8
-
9
-
10
-
11
-
12
-
13
-
14
-
15
-
16
-
17
-
18
-
19
-
20
-
21
-
22
-
23
-
24
-
25
-
26
-
27
-
28
-
29
-
30
-
31
-
32
-
33
-
34
-
35
-
36
-
37
-
38
-
39
-
40
-
41
-
42
-
43
-
44
-
45
-
46
-
47
-
48
-
49
-
50
-
51
-
52
-
53
-
54
-
 55
55 -
 56
56 -
 57
57 -
 58
58 -
 59
59 -
 60
60 -
 61
61 -
 62
62 -
 63
63 -
 64
64 -
 65
65 -
 66
66 -
 67
67 -
 68
68 -
 69
69 -
 70
70 -
 71
71 -
 72
72 -
 73
73 -
 74
74 -
 75
75 -
76
-
77
-
78
-
79
-
80
-
81
-
82
-
83
-
84
-
85
-
86
-
87
-
88
-
89
-
90
-
91
-
92
-
93
-
94
-
95
-
96
-
97
-
98
-
99
-
100
-
101
-
102
-
103
-
104
-
105
-
106
-
107
-
108
-
109
-
110
-
111
-
112
-
113
-
114
-
115
-
116
-
117
-
118
-
119
-
120
-
121
-
122
-
123
-
124
-
125
-
126
-
127
-
128
 |
 |

63
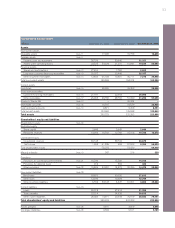
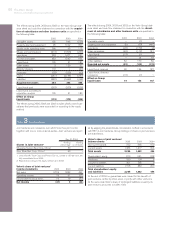
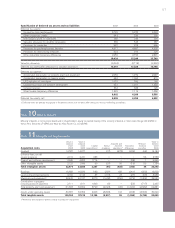
Total shareholders’ equity and liabilities 2002 2003 2004
Operating liabilities, excluding Financial Services: 1
Trucks 50,481 49,261 55,129
Buses 3,006 2,600 3,327
Construction Equipment 4,079 4,822 6,613
Volvo Penta 1,450 1,460 1,621
Volvo Aero 4,629 3,265 3,707
Other 2,330 3,291 2,825
Total operating liabilities excluding Financial Services 65,975 64,699 73,222
Financial liabilities 38,714 39,940 27,854
Tax liabilities 770 650 1,513
Total liabilities in Financial Services 61,870 58,838 63,226
Other and eliminations (6,632) (5,511) (12,557)
Total liabilities 160,697 158,616 153,258
Shareholders’ equity 78,278 72,420 69,409
Minority interests 247 216 229
Volvo Group total 239,222 231,252 222,896
1 Defined as Total liabilities less financial liabilities and tax liabilities.
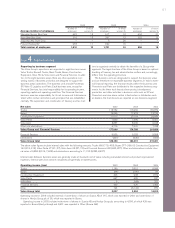
Investments in associated companies 2002 2003 2004
Trucks 213 26 37
Buses 296 21 20
Construction Equipment – – –
Volvo Penta –––
Volvo Aero 44 35 37
Financial Services 208 165 172
Other 896 116 647
Volvo Group total 1,657 363 913
Capital expenditures 2002 2003 2004
Trucks 4,797 4,384 5,030
Buses 256 161 176
Construction Equipment 660 525 1,158
Volvo Penta 236 362 297
Volvo Aero 583 262 801
Other 244 528 237
Volvo Group excl Financial Services 6,776 6,222 7,699
Financial Services 5,461 5,459 4,784
Volvo Group total 12,237 11,681 12,483
Reporting by geographical segment
Net sales 2002 2003 2004
Europe 105,069 109,668 119,077
North America 53,438 44,502 54,094
South America 5,070 5,080 7,338
Asia 12,693 15,819 20,789
Other markets 9,928 8,222 9,103
Volvo Group total* 186,198 183,291 210,401
*of which:
Sweden 12,923 14,801 14,606
United States 44,652 36,406 45,251
France 26,387 25,679 26,900