Volvo 2004 Annual Report Download - page 57
Download and view the complete annual report
Please find page 57 of the 2004 Volvo annual report below. You can navigate through the pages in the report by either clicking on the pages listed below, or by using the keyword search tool below to find specific information within the annual report.-
 1
1 -
2
-
3
-
4
-
5
-
6
-
7
-
8
-
9
-
10
-
11
-
12
-
13
-
14
-
15
-
16
-
17
-
18
-
19
-
20
-
21
-
22
-
23
-
24
-
25
-
26
-
27
-
28
-
29
-
30
-
31
-
32
-
33
-
34
-
35
-
36
-
37
-
38
-
39
-
40
-
41
-
42
-
43
-
44
-
45
-
46
-
 47
47 -
 48
48 -
 49
49 -
 50
50 -
 51
51 -
 52
52 -
 53
53 -
 54
54 -
 55
55 -
 56
56 -
 57
57 -
 58
58 -
 59
59 -
 60
60 -
 61
61 -
 62
62 -
 63
63 -
 64
64 -
 65
65 -
 66
66 -
 67
67 -
68
-
69
-
70
-
71
-
72
-
73
-
74
-
75
-
76
-
77
-
78
-
79
-
80
-
81
-
82
-
83
-
84
-
85
-
86
-
87
-
88
-
89
-
90
-
91
-
92
-
93
-
94
-
95
-
96
-
97
-
98
-
99
-
100
-
101
-
102
-
103
-
104
-
105
-
106
-
107
-
108
-
109
-
110
-
111
-
112
-
113
-
114
-
115
-
116
-
117
-
118
-
119
-
120
-
121
-
122
-
123
-
124
-
125
-
126
-
127
-
128
 |
 |
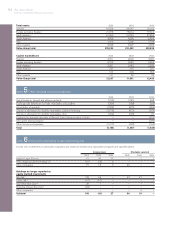
55
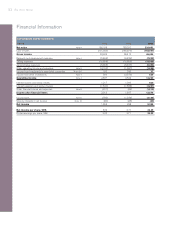
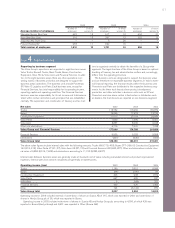
Consolidated cash-flow statements
SEK M 2002 2003 2004
Operating activities
Operating income 2,837 2,504 14,200
Depreciation and amortization Note 11 10,844 10,169 10,305
Other items not affecting cash Note 27 1,955 4,929 147
Changes in working capital:
(Increase)/decrease in receivables 3,649 517 (4,017)
(Increase)/decrease in inventories 53 1,433 (2,243)
Increase/(decrease) in liabilities and provisions (2,692) (1,507) 4,797
Interest and similar items received 942 1,437 1,047
Interest and similar items paid (1,047) (1,160) (335)
Other financial items (170) (62) (25)
Income taxes paid (1,069) (1,165) (1,194)
Cash flow from operating activities 15,302 17,095 22,682
Investing activities
Investments in fixed assets (6,665) (6,005) (7,405)
Investments in leasing assets (5,179) (5,333) (4,360)
Disposals of fixed assets and leasing assets 3,162 2,935 2,444
Customer-financing receivables, net Note 27 (5,739) (4,316) (7,382)
Shares and participations, net Note 27 (88) (61) 15,064
Acquired and divested subsidiaries
and other business units, net Note 2, 27 (159) (14,668) (39) (12,819) (141) (1,780)
Cash flow after net investments 634 4,276 20,902
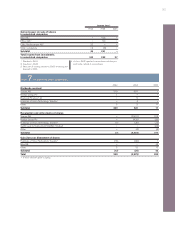
Financing activities
Increase (decrease) in bond loans and other loans Note 27 (111) 1,868 (8,840)
Loans to external parties, net Note 27 1,692 933 13
Cash dividend to AB Volvo shareholders’ (3,356) (3,356) (3,356)
Repurchase of own shares – – (2,532)
Dividends to minority shareholders (13) (9) (9)
Other 12 (1,776) 63 (501) 38 (14,686)
Change in liquid funds, excluding
translation differences (1,142) 3,775 6,216
Translation difference on liquid funds (663) (618) (205)
Change in liquid funds (1,805) 3,157 6,011
Liquid funds, January 1 27,383 25,578 28,735
Liquid funds, December 31 25,578 28,735 34,746
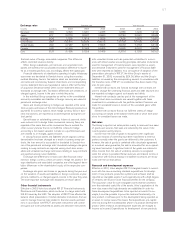
The effects of major acquisitions and divestments of subsidiaries in each year
have been excluded from other changes from the balance sheet items in the
cash-flow statement. The effects of currency movements in translation of
foreign Group companies have also been excluded since these effects do not
affect cash flow. Liquid funds include cash and bank balances and marketable
securities.