Volvo 2004 Annual Report Download - page 74
Download and view the complete annual report
Please find page 74 of the 2004 Volvo annual report below. You can navigate through the pages in the report by either clicking on the pages listed below, or by using the keyword search tool below to find specific information within the annual report.-
 1
1 -
2
-
3
-
4
-
5
-
6
-
7
-
8
-
9
-
10
-
11
-
12
-
13
-
14
-
15
-
16
-
17
-
18
-
19
-
20
-
21
-
22
-
23
-
24
-
25
-
26
-
27
-
28
-
29
-
30
-
31
-
32
-
33
-
34
-
35
-
36
-
37
-
38
-
39
-
40
-
41
-
42
-
43
-
44
-
45
-
46
-
47
-
48
-
49
-
50
-
51
-
52
-
53
-
54
-
55
-
56
-
57
-
58
-
59
-
60
-
61
-
62
-
63
-
 64
64 -
 65
65 -
 66
66 -
 67
67 -
 68
68 -
 69
69 -
 70
70 -
 71
71 -
 72
72 -
 73
73 -
 74
74 -
 75
75 -
 76
76 -
 77
77 -
 78
78 -
 79
79 -
 80
80 -
 81
81 -
 82
82 -
 83
83 -
 84
84 -
85
-
86
-
87
-
88
-
89
-
90
-
91
-
92
-
93
-
94
-
95
-
96
-
97
-
98
-
99
-
100
-
101
-
102
-
103
-
104
-
105
-
106
-
107
-
108
-
109
-
110
-
111
-
112
-
113
-
114
-
115
-
116
-
117
-
118
-
119
-
120
-
121
-
122
-
123
-
124
-
125
-
126
-
127
-
128
 |
 |

72 The Volvo Group
Notes to consolidated financial statements
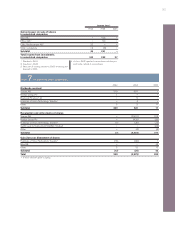
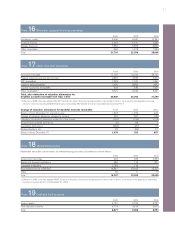
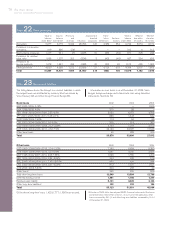
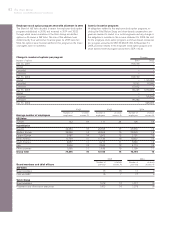
Assumptions applied for 2003 2004
actuarial calculations January 1 December 31 December 31
Sweden
Discount rate 5.5 5.5 5.0
Expected return on
plan assets16.0 6.0 6.0
Expected salary increases 3.0 3.0 3.2
United States
Discount rate 6.75 6.25 5.75
Expected return on
plan assets17.65 7.65 7.65
Expected salary increases 3.5 3.5 3.5
France
Discount rate 5.5 5.25 4.75
Expected salary increases 3.0 3.0 3.0
Great Britain
Discount rate 5.5 5.5 5.25
Expected return on
plan assets17.0 7.0 6.25
Expected salary increases 3.5 3.5 3.5
1 Applicable for the following accounting period. These assumptions reflect
the expected long-term return rate on plan assets, based upon historical
yield rates for different categories of investments and weighted in accord-
ance with the foundation’s investment policy. The expected return has been
calculated net of administrative expenses and applicable taxes.
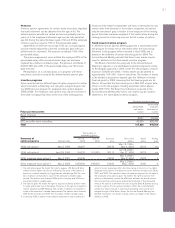
Note 21Provisions for post-employment benefits
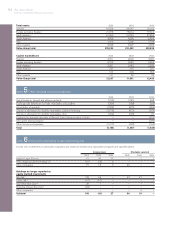
Note 20 Shareholders’ equity
The share capital of the Parent Company is divided into two series of
shares: A and B. Both series carry the same rights, except that each
Series A share carries the right to one vote and each Series B share
carries the right to one tenth of a vote.
The total number of registered shares by year end 2004 amount-
ed to 441,520,885. After repurchase of additionally 2% of the regis-
tered shares during 2004, Volvo held 7% of the registered shares at
year end 2004. The total number of outstanding Volvo shares by year
end 2004 amounted to 410,129,842 whereof Series A shares
131,529,699 and Series B shares 278,600,143. Par value per share
is SEK 6.00. Total par value was 2,649 and is based on 441,520,885
registered shares. The average number of outstanding shares was
418,528,078 in 2004.
In accordance with the Swedish Companies Act, distribution of
dividends is limited to the lesser of the unrestricted equity shown in
the consolidated or Parent Company balance sheets after proposed
appropriations to restricted equity. Unrestricted equity in the Parent
Company at December 31, 2004 amounted to 43,778.
As of December 31, 2004, Volvo-related foundations’ holdings in
Volvo were 0.05% of the share capital and 0.12% of the voting
rights.
As shown in the consolidated balance sheet as of December 31,
2004, unrestricted equity amounted to 56,034 (57,002; 61,536). It is
estimated that 0 of this amount will be allocated to restricted
reserves.
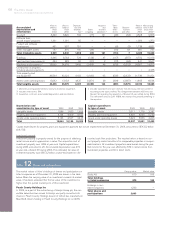
Post-employment benefits, such as pensions, healthcare and other
benefits are mainly settled by means of regular payments to inde-
pendent authorities or bodies that assume pension obligations and
administer pensions through defined contribution plans. The remain-
ing post-employment benefits are defined benefit plans; that is, the
obligations remain within the Volvo Group or are secured by own
pension foundations. Costs and the obligations at the end of period
for defined benefit plans are calculated based on actuarial assump-
tions and measured on a discounted basis. The Volvo group defined
benefits plans relate mainly to subsidiaries in the US and comprise
both pensions and other benefits, such as healthcare. Other large-
scale defined benefit plans apply for salaried employees in Sweden
(mainly through the Swedish ITP pension plan) and employees in
France and Great Britain.
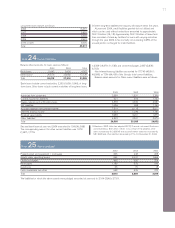
As of 2003 Volvo has adopted RR 29 Employee Benefits in its
financial reporting. In accordance with the new standard, defined
benefit plans in all the Group’s subsidiaries are accounted for by use
of consistent principles. In Volvo’s financial reporting up to 2002,
such plans have been accounted for by applying the local rules and
directives in each country. In accordance with the transition rules, a
transitional liability was established as at January 1, 2003, determined
in accordance with RR 29. This transitional liability exceeded the
liability recognized as at December 31, 2002, in accordance with earlier
principles by SEK 2.3 billion. The excess liability was consequently
recognized as at January 1, 2003, as an increase in provisions for
post-employment benefits and a corresponding decrease in share-
holders’ equity. Comparable figures for 2002 have not been restated.
See note 1 for further information about the accounting principles.
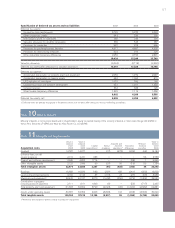
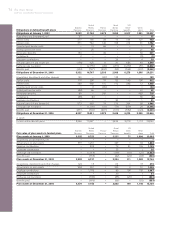
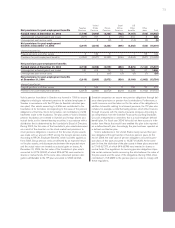
The following tables disclose information about defined benefit
plans in the Volvo Group. The information refers to assumptions
applied for actuarial calculations, periodical costs and the value of
obligations and plan assets at year-end. The tables also include
reconciliation of obligations and plan assets during the year and the
difference between fair values and carrying amounts reported on the
balance sheet date.