Volvo 2004 Annual Report Download - page 14
Download and view the complete annual report
Please find page 14 of the 2004 Volvo annual report below. You can navigate through the pages in the report by either clicking on the pages listed below, or by using the keyword search tool below to find specific information within the annual report.-
 1
1 -
2
-
3
-
 4
4 -
 5
5 -
 6
6 -
 7
7 -
 8
8 -
 9
9 -
 10
10 -
 11
11 -
 12
12 -
 13
13 -
 14
14 -
 15
15 -
 16
16 -
 17
17 -
 18
18 -
 19
19 -
 20
20 -
 21
21 -
 22
22 -
 23
23 -
 24
24 -
25
-
26
-
27
-
28
-
29
-
30
-
31
-
32
-
33
-
34
-
35
-
36
-
37
-
38
-
39
-
40
-
41
-
42
-
43
-
44
-
45
-
46
-
47
-
48
-
49
-
50
-
51
-
52
-
53
-
54
-
55
-
56
-
57
-
58
-
59
-
60
-
61
-
62
-
63
-
64
-
65
-
66
-
67
-
68
-
69
-
70
-
71
-
72
-
73
-
74
-
75
-
76
-
77
-
78
-
79
-
80
-
81
-
82
-
83
-
84
-
85
-
86
-
87
-
88
-
89
-
90
-
91
-
92
-
93
-
94
-
95
-
96
-
97
-
98
-
99
-
100
-
101
-
102
-
103
-
104
-
105
-
106
-
107
-
108
-
109
-
110
-
111
-
112
-
113
-
114
-
115
-
116
-
117
-
118
-
119
-
120
-
121
-
122
-
123
-
124
-
125
-
126
-
127
-
128
 |
 |

12 Board of Directors’ Report
Balance sheet
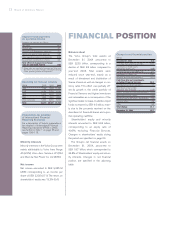
The Volvo Group’s total assets at
December 31, 2004 amounted to
SEK 222.9 billion, corresponding to a
decline of SEK 8.4 billion compared to
year-end 2003. Total assets were
reduced since year-end, mainly as a
result of divestment and distribution of
Scania shares as well as changes in cur-
rency rates. This effect was partially off-
set by growth in the credit portfolio of
Financial Services and higher inventories
and receivables as a consequence of the
significant sales increase. In addition, liquid
funds increased by SEK 6.0 billion, main-
ly due to the proceeds received on the
divestment of Scania B shares and a pos-
itive operating cashflow.
Shareholders’ equity and minority
interests amounted to SEK 69.6 billion,
corresponding to an equity ratio of
40.0%, excluding Financial Services.
Changes in shareholders’ equity during
the period are specified on page 54.
The Group’s net financial assets on
December 31, 2004, amounted to
SEK 18.7 billion, which corresponded to
26.8% of Shareholders’ equity and minor-
ity interests. Changes in net financial
position are specified in the adjoining
table.
Minority interests
Minority interests in the Volvo Group were
mainly attributable to Volvo Aero Norge
AS (22%), Volvo Aero Services LP (5%)
and Wuxi da Hao Power Co, Ltd (30%).
Net income
Net income amounted to SEK 9,355 M
(298) corresponding to an income per
share of SEK 22.35 (0.71). The return on
shareholders’ equity was 13.2% (0.4).
Preparations for adoption
of International Financial
Reporting Standards
For a description of Volvo’s preparations
for adoption of International Financial
Reporting Standards (IFRS) in 2005,
see further in Note 1 on page 56 and
pages 108–115.
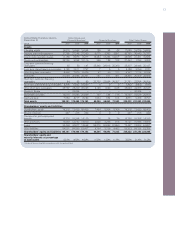
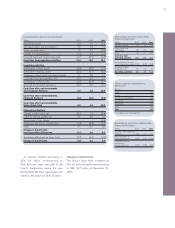
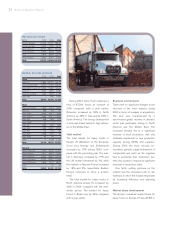
Impact of exchange rates
on operating income
Compared with preceding year, SEK bn
Net sales1(5.7)
Cost of sales 3,7
Research and development expenses 0.1
Selling and administrative expenses 0.5
Other operating income and expenses (0.4)
Income from investments in shares 0.0
Total effect of changes in exchange
rates on operating income (1.8)
1 Group sales are reported at average spot rates and
the effects of currency hedges are reported among
“Other operating income and expenses.”
Operating net flow per currency
SEKM 2002 2003 2004
USD 7,100 7,500 13,100
EUR5,100 7,300 6,700
GBP 5,400 3,400 4,200
CAD 1,600 1,600 2,800
Other currencies 5,000 5,200 9,300
Total 24,200 25,000 36,100
Change in net financial position
SEK bn
December 31, 2003 2.4
Cash flow from operating activities 18.1
Investments in fixed assets
and leasing assets, net (6.8)
Customer financie receivables, net 0.1
Investments in shares, net 15.1
Acquired and divested operations (0.1)
Cash flow after net investments,
excluding Financial Services 26.4
Contribution to US pension plans 1.1
Write-down of convertible
debenture loan to Henlys (1.2)
Debt in acquired and divested operations (0.7)
Repurchase of own shares (2.5)
Dividend paid to AB Volvo's shareholders (3.4)
Currency effect 0.8
Other 0.6
Total change 21.1
December 31, 2004 18.7
FINANCIAL POSITION