Volvo 2004 Annual Report Download - page 79
Download and view the complete annual report
Please find page 79 of the 2004 Volvo annual report below. You can navigate through the pages in the report by either clicking on the pages listed below, or by using the keyword search tool below to find specific information within the annual report.-
 1
1 -
2
-
3
-
4
-
5
-
6
-
7
-
8
-
9
-
10
-
11
-
12
-
13
-
14
-
15
-
16
-
17
-
18
-
19
-
20
-
21
-
22
-
23
-
24
-
25
-
26
-
27
-
28
-
29
-
30
-
31
-
32
-
33
-
34
-
35
-
36
-
37
-
38
-
39
-
40
-
41
-
42
-
43
-
44
-
45
-
46
-
47
-
48
-
49
-
50
-
51
-
52
-
53
-
54
-
55
-
56
-
57
-
58
-
59
-
60
-
61
-
62
-
63
-
64
-
65
-
66
-
67
-
68
-
 69
69 -
 70
70 -
 71
71 -
 72
72 -
 73
73 -
 74
74 -
 75
75 -
 76
76 -
 77
77 -
 78
78 -
 79
79 -
 80
80 -
 81
81 -
 82
82 -
 83
83 -
 84
84 -
 85
85 -
 86
86 -
 87
87 -
 88
88 -
 89
89 -
90
-
91
-
92
-
93
-
94
-
95
-
96
-
97
-
98
-
99
-
100
-
101
-
102
-
103
-
104
-
105
-
106
-
107
-
108
-
109
-
110
-
111
-
112
-
113
-
114
-
115
-
116
-
117
-
118
-
119
-
120
-
121
-
122
-
123
-
124
-
125
-
126
-
127
-
128
 |
 |

77
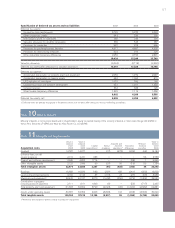
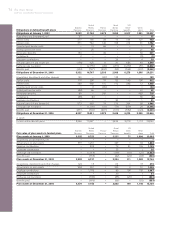
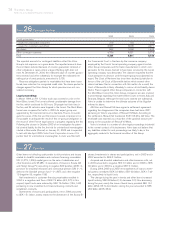
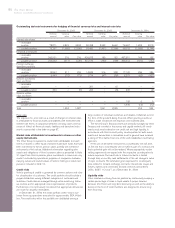
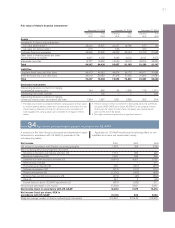
Long-term loans mature as follows:
2006 15,637
2007 9,858
2008 5,358
2009 2,922
2010 or later 6,636
Total 40,411
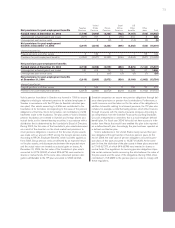
Of other long-term liabilities the majority will mature within five years.
At year-end 2004, credit facilities granted but not utilized and
which can be used without restrictions amounted to approximately
SEK 19 billion (15; 18). Approximately SEK 18 billion of these facil-
ities consisted of stand-by facilities for loans with varying maturities
through the year 2009. A fee normally not exceeding 0.25% of the
unused portion is charged for credit facilities.
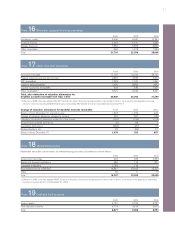
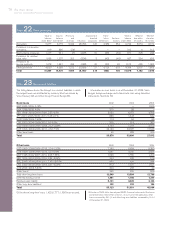
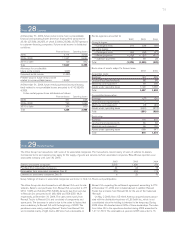
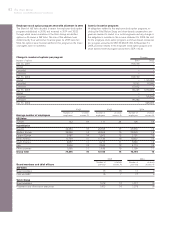
Note 24Current liabilities
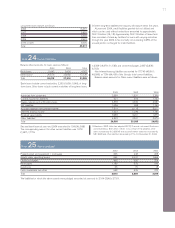
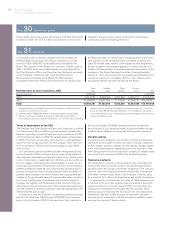
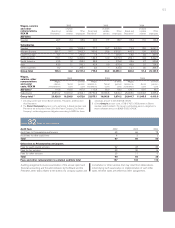
Note 25Assets pledged
Balance sheet amounts for loans were as follows:
2002 2003 2004
Bank loans 5,442 3,430 4,267
Other loans 120,576 23,988 17,129
Total 26,018 27,418 21,396
13,324 (14,470; 11,138), and commercial paper, 2,667 (5,836;
8,762).
Non-interest-bearing liabilities accounted for 57,745 (49,561;
48,599), or 73% (64; 65) of the Group’s total current liabilities.
Balance sheet amounts for Other current liabilities were as follows:
Bank loans include current maturities, 2,259 (1,659; 1,046), of long-
term loans. Other loans include current maturities of long-term loans,
2002 2003 2004
Advances from customers 2,589 1,821 2,298
Current income tax liabilities 621 459 1,753
Wages, salaries and withholding taxes 4,335 4,630 4,987
VAT liabilities 1,056 988 1,193
Accrued expenses and prepaid income17,315 8,113 9,811
Deferred leasing income 1,652 1,230 1,141
Residual value liability 3,985 3,201 1,873
Other liabilities14,832 4,591 3,876
Total 26,385 25,033 26,932
Secured bank loans at year-end 2004 amounted to 194 (96; 588).
The corresponding amount for other current liabilities was 1,578
(1,987; 1,775).
The liabilities for which the above assets were pledged amounted at year-end to 3,194 (3,860; 3,721).
2002 2003 2004
Property, plant and equipment – mortgages 356 248 205
Assets under operating leases 964 2,031 1,665
Chattel mortgages 495 350 374
Receivables 1,180 678 319
Inventories 66 76 13
Cash, marketable securities 549 426 470
Total 3,610 3,809 3,046
1 Effective in 2003, Volvo has adopted RR 27, Financial instrument; Disclosure
and presentation. See further in Note 1. As a result of the adoption, other
loans increased by 612 (3,000) and accrued interest expenses increased by
981 (600) and other liabilities decreased by 77 (–) at December 31, 2004.