Volvo 2004 Annual Report Download - page 62
Download and view the complete annual report
Please find page 62 of the 2004 Volvo annual report below. You can navigate through the pages in the report by either clicking on the pages listed below, or by using the keyword search tool below to find specific information within the annual report.-
 1
1 -
2
-
3
-
4
-
5
-
6
-
7
-
8
-
9
-
10
-
11
-
12
-
13
-
14
-
15
-
16
-
17
-
18
-
19
-
20
-
21
-
22
-
23
-
24
-
25
-
26
-
27
-
28
-
29
-
30
-
31
-
32
-
33
-
34
-
35
-
36
-
37
-
38
-
39
-
40
-
41
-
42
-
43
-
44
-
45
-
46
-
47
-
48
-
49
-
50
-
51
-
 52
52 -
 53
53 -
 54
54 -
 55
55 -
 56
56 -
 57
57 -
 58
58 -
 59
59 -
 60
60 -
 61
61 -
 62
62 -
 63
63 -
 64
64 -
 65
65 -
 66
66 -
 67
67 -
 68
68 -
 69
69 -
 70
70 -
 71
71 -
 72
72 -
73
-
74
-
75
-
76
-
77
-
78
-
79
-
80
-
81
-
82
-
83
-
84
-
85
-
86
-
87
-
88
-
89
-
90
-
91
-
92
-
93
-
94
-
95
-
96
-
97
-
98
-
99
-
100
-
101
-
102
-
103
-
104
-
105
-
106
-
107
-
108
-
109
-
110
-
111
-
112
-
113
-
114
-
115
-
116
-
117
-
118
-
119
-
120
-
121
-
122
-
123
-
124
-
125
-
126
-
127
-
128
 |
 |

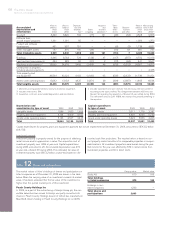
60 The Volvo Group
Notes to consolidated financial statements
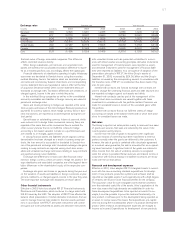
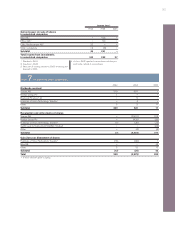
The effects during 2004, 2003 and 2002 on the Volvo Group’s bal-
ance sheet and cash flow statement in connection with the divest-
ment of subsidiaries and other business units are specified in
the following table:
2002 2003 2004
Intangible assets – (1) –
Property, plant and equipment (5) (23) (440)
Inventories (23) (170) (4)
Other receivables (43) (112) 181
Liquid funds (13) (1) –
Provisions – 24 94
Other liabilities 52 170 50
Divested net assets (32) (113) (119)
Liquid funds received 32 134 187
Liquid funds, divested
companies (13) (1) –
Effect on Group
liquid funds 19 133 187
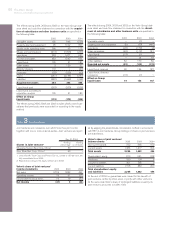
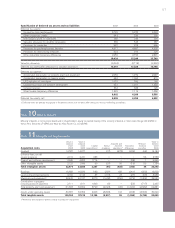
The effects during 2004, 2003 and 2002 on the Volvo Group’s bal-
ance sheet and cash flow statement in connection with the acquisi-
tion of subsidiaries and other business units are specified in
the following table:
2002 2003 2004
Intangible assets 135 948 (599)
Property, plant and equipment 95 1,102 300
Assets under operating lease 286 95 115
Shares and participations (214) (1,303) (260)
Inventories 234 1,477 630
Current receivables 382 1,562 958
Liquid funds 105 31 180
Other assets 3 129 62
Minority interests 119 – (20)
Provisions (33) (225) (63)
Loans (247) (2,144) (347)
Liabilities (582) (1,469) (448)
Acquired net assets 283 203 508
Liquid funds paid (283) (203) (508)
Liquid funds according to
acquisition analysis 105 31 180
Effect on Group
liquid funds (178) (172) (328)
The effects during 2004, 2003 and 2002 includes wholly owned sub-
sidiaries that previously were accounted for according to the equity
method.
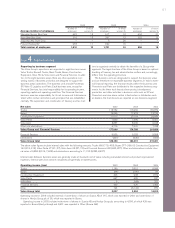
Note 3Joint ventures
Joint ventures are companies over which Volvo has joint control
together with one or more external parties. Joint ventures are report-
ed by applying the proportionate consolidation method, in accordance
with RR 14 Joint ventures. Group holdings of shares in joint ventures
are listed below.
Dec 31, 2004
Holding Holding
Shares in Joint ventures1percentage no of shares
Shanghai Sunwin Bus Corp., China250 –
Xian Silver Bus Corp., China250 –
1Jinan Hua Wo Truck Corp. and Prevóst Car Inc., owned to 100 per cent, are
fully consolidated from 2004.
2Reported according to the equity method up to 2002.
Volvo’s share of joint ventures’
income statements 2002 2003 2004
Net sales 2,724 1,832 492
Operating income 74 51 (27)
Income after financial items 10 19 (32)
Net income (21) 3 (34)
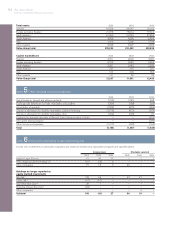
Volvo’s share of joint ventures’
balance sheets 2002 2003 2004
Non-current assets 782 665 100
Current assets 1,484 1,217 394
Total assets 2,266 1,882 494
Shareholders’ equity 570 581 228
Provisions 180 124 6
Long-term liablities 361 295 0
Current liabilities 1,155 882 260
Total shareholders’ equity
and liabilities 2,266 1,882 494
At the end of 2004 no guarantees were issued for the benefit of
joint ventures, neither by Volvo alone or jointly with other venturers.
At the same date Volvo’s share of contingent liabilities issued by its
joint ventures amounted to 6 (96; 109).