Volvo 2004 Annual Report Download - page 15
Download and view the complete annual report
Please find page 15 of the 2004 Volvo annual report below. You can navigate through the pages in the report by either clicking on the pages listed below, or by using the keyword search tool below to find specific information within the annual report.-
 1
1 -
2
-
3
-
4
-
 5
5 -
 6
6 -
 7
7 -
 8
8 -
 9
9 -
 10
10 -
 11
11 -
 12
12 -
 13
13 -
 14
14 -
 15
15 -
 16
16 -
 17
17 -
 18
18 -
 19
19 -
 20
20 -
 21
21 -
 22
22 -
 23
23 -
 24
24 -
 25
25 -
26
-
27
-
28
-
29
-
30
-
31
-
32
-
33
-
34
-
35
-
36
-
37
-
38
-
39
-
40
-
41
-
42
-
43
-
44
-
45
-
46
-
47
-
48
-
49
-
50
-
51
-
52
-
53
-
54
-
55
-
56
-
57
-
58
-
59
-
60
-
61
-
62
-
63
-
64
-
65
-
66
-
67
-
68
-
69
-
70
-
71
-
72
-
73
-
74
-
75
-
76
-
77
-
78
-
79
-
80
-
81
-
82
-
83
-
84
-
85
-
86
-
87
-
88
-
89
-
90
-
91
-
92
-
93
-
94
-
95
-
96
-
97
-
98
-
99
-
100
-
101
-
102
-
103
-
104
-
105
-
106
-
107
-
108
-
109
-
110
-
111
-
112
-
113
-
114
-
115
-
116
-
117
-
118
-
119
-
120
-
121
-
122
-
123
-
124
-
125
-
126
-
127
-
128
 |
 |
13
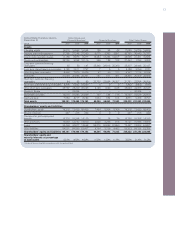
Consolidated balance sheets, Volvo Group, excl
December 31 Financial Services1Financial Services Total Volvo Group
SEK M 2002 2003 2004 2002 2003 2004 2002 2003 2004
Assets
Intangible assets 16,919 16,662 16,564 126 94 42 17,045 16,756 16,606
Property, plant and equipment 27,789 27,248 27,260 3,010 3,392 3,891 30,799 30,640 31,151
Assets under operating leases 11,155 8,976 8,477 13,284 13,234 12,817 23,525 21,201 19,534
Shares and participations 34,750 9,598 10,116 236 188 193 27,492 1,782 2,003
Long-term customer-financing
receivables 55 53 147 25,348 23,918 25,200 25,207 23,448 25,187
Long-term interest-bearing receivables 4,189 2,911 1,797 7 5 5 4,188 2,769 1,741
Other long-term receivables 8,489 7,879 6,426 47 59 212 8,297 7,718 6,034
Inventories 27,564 25,848 28,291 741 611 307 28,305 26,459 28,598
Short-term customer-financing
receivables 44 65 83 22,700 22,894 26,207 21,791 22,554 26,006
Short-term interest-bearing receivables 4,306 6,502 10,330 0 0 0 1,302 3,863 1,643
Other short-term receivables 25,767 25,200 30,043 2,126 1,649 1,628 25,693 24,903 29,647
Shares in Scania – 20,424 – – – – – 20,424 –
Marketable securities 16,570 19,385 25,839 137 144 116 16,707 19,529 25,955
Cash and bank 7,584 8,717 8,789 1,602 654 914 8,871 9,206 8,791
Total assets 185,181 179,468 174,162 69,364 66,842 71,532 239,222 231,252 222,896
Shareholders’ equity and liabilities
Shareholders' equity 78,278 72,420 69,409 7,494 8,004 8,306 78,278 72,420 69,409
Minority interests 247 216 229 0 0 0 247 216 229
Provisions for post-employment
benefits 16,218 15,264 14,129 18 24 26 16,236 15,288 14,155
Other provisions 13,893 12,792 14,020 2,828 2,256 878 16,721 15,048 14,898
Loans 22,494 24,677 13,968 54,270 52,852 57,860 72,437 74,092 61,807
Other liabilities 54,051 54,099 62,407 4,754 3,706 4,462 55,303 54,188 62,398
Shareholders’ equity and liabilities 185,181 179,468 174,162 69,364 66,842 71,532 239,222 231,252 222,896
Shareholders’ equity and
minority interests as percentage
of total assets 42.4% 40.5% 40.0% 10.8% 12.0% 11.6% 32.8% 31.4% 31.2%
1 Financial Services reported in accordance with the equity method.