Volvo 2004 Annual Report Download - page 87
Download and view the complete annual report
Please find page 87 of the 2004 Volvo annual report below. You can navigate through the pages in the report by either clicking on the pages listed below, or by using the keyword search tool below to find specific information within the annual report.-
 1
1 -
2
-
3
-
4
-
5
-
6
-
7
-
8
-
9
-
10
-
11
-
12
-
13
-
14
-
15
-
16
-
17
-
18
-
19
-
20
-
21
-
22
-
23
-
24
-
25
-
26
-
27
-
28
-
29
-
30
-
31
-
32
-
33
-
34
-
35
-
36
-
37
-
38
-
39
-
40
-
41
-
42
-
43
-
44
-
45
-
46
-
47
-
48
-
49
-
50
-
51
-
52
-
53
-
54
-
55
-
56
-
57
-
58
-
59
-
60
-
61
-
62
-
63
-
64
-
65
-
66
-
67
-
68
-
69
-
70
-
71
-
72
-
73
-
74
-
75
-
76
-
 77
77 -
 78
78 -
 79
79 -
 80
80 -
 81
81 -
 82
82 -
 83
83 -
 84
84 -
 85
85 -
 86
86 -
 87
87 -
 88
88 -
 89
89 -
 90
90 -
 91
91 -
 92
92 -
 93
93 -
 94
94 -
 95
95 -
 96
96 -
 97
97 -
98
-
99
-
100
-
101
-
102
-
103
-
104
-
105
-
106
-
107
-
108
-
109
-
110
-
111
-
112
-
113
-
114
-
115
-
116
-
117
-
118
-
119
-
120
-
121
-
122
-
123
-
124
-
125
-
126
-
127
-
128
 |
 |

85
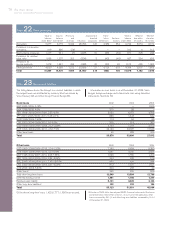
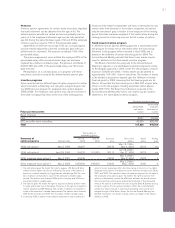
Financial currency risks
Loans and deposits in the Group companies are mainly made through
Volvo Treasury in local currencies and financial currency exposure in
the individual entities are thereby being minimized. Volvo Treasury uses
various derivative instruments in order to provide deposits and lend-
ing in different currencies without increasing the company’s own risk.
The Volvo Group’s net financial position is being affected by changes
in currency rates because financial assets and liabilities are allocated
between Group companies operating in different currencies. Carrying
amounts, fair values and additional specifications of derivative instru-
ments used to manage currency and interest rate risks related to
financial assets and liabilities are shown in the table on page 86.
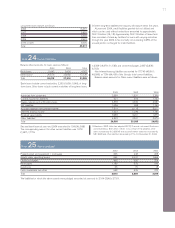
Equity currency risks
The Group value of assets and liabilities in foreign subsidiaries is
affected by currency exchange rates in connection with the trans-
lation to SEK. Equity currency risks are being minimized by ongoing
optimization of the amount of equity in foreign subsidiaries with con-
sideration of commercial and legal prerequisites. Equity hedging
could be made if the equity level of a foreign subsidiary is consid-
ered as too high. At year-end 2004, net assets in subsidiaries and in
associated companies outside Sweden amounted to SEK 24.6 bil-
lion. Of this amount, SEK 0.7 billion was hedged by loans in foreign
currencies. Hedging of investments in associated companies and
other companies will be executed on a case-by-case basis.
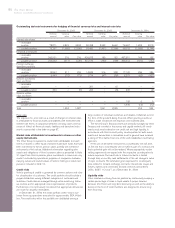
Interest rate risks
Interest rate risks include the risks that changes in interest rates
affects the Group’s income and cash-flow (cash-flow risks) or the
fair value of financial assets and liabilities (price risks). By matching
fixed interest periods of financial assets and liabilities the exposure
for interest rate risks is reduced. Interest rate swaps are used to
change the fixed interest rate periods of the Group’s financial assets
and liabilities. Exchange rate swaps make it possible to borrow in
foreign currencies in different markets without incurring currency
risks. Volvo also holds standardized futures and forward rate agree-
ments. The majority of these contracts are used to secure interest
levels for short-term borrowing or deposits. Carrying amounts, fair
values and additional specifications of derivative instruments used to
manage currency and interest rate risks related to financial assets
and liabilities are shown in the adjoining table.
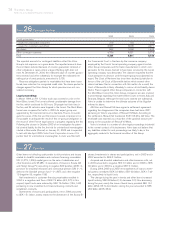
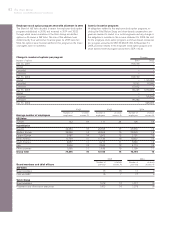
Cash-flow risks
The exposure for cash-flow risks related to changes in interest rates
pertains mainly to the Group’s customer financing operations and
interest net. According to the Group policy, matching of interest rate
terms between lending and funding should exceed 80% in the cus-
tomer financing operations. At the end of 2004, this matching was
100%. Volvo’s interest-bearing assets, apart from the customer
financing portfolio, consisted at the end of 2004 mainly of liquid
funds that were invested in interest bearing securities with short-
term maturities. By use of derivative instruments, the target is to
achieve a fixed interest period of six months for the Group’s liquid
funds. At December 31, 2004, the average interest rate on liquid
funds was 2.3%. Volvo’s interest bearing liabilities, apart from loans
designated to funding of the customer financing portfolio, consisted
on the same date mainly of provisions for post-employment benefits
and loans. For the outstanding loans, the interest rate terms with
consideration of derivative instruments were corresponding to a fixed
interest period of six months. The average interest rate at year-end
was 3.7%.
If assuming an instantaneous one percentage (100 basis points)
increase in interest rates of all currencies from their levels at
December 31, 2004, with all other variables held constant, Volvo’s
income after financial items over a 12-month period would increase
by 246. If assuming a corresponding one percentage (100 basis
points) decrease in interest rates, Volvo’s income after financial items
would decrease by the same amount. It should be noted that the
assumptions on which this sensitivity analysis is based upon rarely
occur in reality. Actual interest rates rarely move instantaneously.
Also, the sensitivity analysis assumes a parallel shift of the yield
curve and that both assets and liabilities react correspondingly to
changes in market interest rates. The impact from actual interest
rate movements may thus differ from the above analysis.
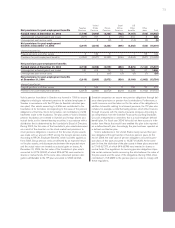
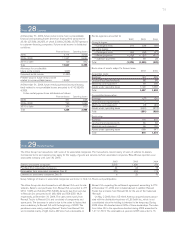
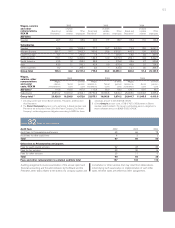
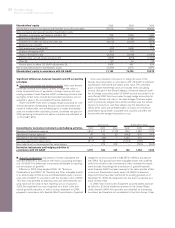
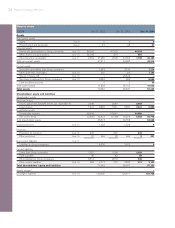
Outstanding forward contracts and option contracts for hedging of commercial currency risks
December 31, 2002 December 31, 2003 December 31, 2004
Notional Carrying Notional Carrying Notional Carrying
amount 1value Fair value amount 1value Fair value amount 1value Fair value
Foreign exchange
forward contracts
– receivable
position 25,857 149 1,017 19,823 53 1,449 26,203 264 1,775
– payable position 10,210 (5) (202) 6,104 – (208) 9,982 (88) (511)
Options – purchased
– receivable
position 4,484 – 94 8,012 – 148 2,831 – 112
– payable position 117 – (1) 110 – – – – –
Options – written
– receivable
position ––––––233–0
– payable position 3,458 – (53) 7,082 – (54) 2,729 – (5)
Subtotal 144 855 53 1,335 176 1,371
Commodity forward contracts
– receivable
position 223 – 272 148 – 19 (10) – 7
– payable position 88 – (113) 119 – (14) 243 – (32)
Total 144 1,014 53 1,340 176 1,346
1 The notional amount of the derivative contracts represents the gross contract amount outstanding. To determine the estimated fair value, the major part of the
outstanding contracts have been marked to market. Discounted cash flows have been used in some cases.