Volvo 2004 Annual Report Download - page 122
Download and view the complete annual report
Please find page 122 of the 2004 Volvo annual report below. You can navigate through the pages in the report by either clicking on the pages listed below, or by using the keyword search tool below to find specific information within the annual report.-
 1
1 -
2
-
3
-
4
-
5
-
6
-
7
-
8
-
9
-
10
-
11
-
12
-
13
-
14
-
15
-
16
-
17
-
18
-
19
-
20
-
21
-
22
-
23
-
24
-
25
-
26
-
27
-
28
-
29
-
30
-
31
-
32
-
33
-
34
-
35
-
36
-
37
-
38
-
39
-
40
-
41
-
42
-
43
-
44
-
45
-
46
-
47
-
48
-
49
-
50
-
51
-
52
-
53
-
54
-
55
-
56
-
57
-
58
-
59
-
60
-
61
-
62
-
63
-
64
-
65
-
66
-
67
-
68
-
69
-
70
-
71
-
72
-
73
-
74
-
75
-
76
-
77
-
78
-
79
-
80
-
81
-
82
-
83
-
84
-
85
-
86
-
87
-
88
-
89
-
90
-
91
-
92
-
93
-
94
-
95
-
96
-
97
-
98
-
99
-
100
-
101
-
102
-
103
-
104
-
105
-
106
-
107
-
108
-
109
-
110
-
111
-
 112
112 -
 113
113 -
 114
114 -
 115
115 -
 116
116 -
 117
117 -
 118
118 -
 119
119 -
 120
120 -
 121
121 -
 122
122 -
 123
123 -
 124
124 -
 125
125 -
 126
126 -
 127
127 -
 128
128
 |
 |
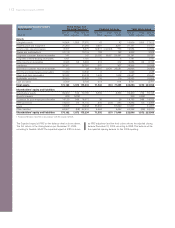
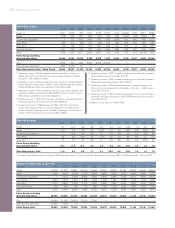
120 Eleven-year summary
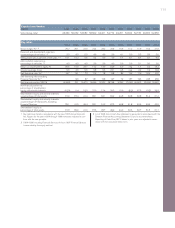
Other share data
1994 1995 1996 1997 1998 1999 2000 2001 2002 2003 2004
Number of shareholders at year-end 182,700 206,700 176,800 225,500 210,600 238,000 230,000 214,000 211,000 208,500 202,300
Number of Series A shares outstanding
at year-end, millions 142.2 142.2 142.2 138.6 138.6 138.6 124.7 131.7 131.7 131.7 131.5
Number of Series B shares outstanding
at year-end, millions 301.9 321.4 321.4 302.9 302.9 302.9 272.6 287.8 287.8 287.8 278.6
Average number of outstanding shares, millions 415.9 458.9 463.6 452.5 441.5 441.5 421.7 422.4 419.4 419.4 418.5
Number of Series A shares traded in
Stockholm during the year, millions 54.1 23.2 23.7 23.7 34.5 27.0 42.4 40.3 27.3 31.4 42.0
Number of Series B shares traded in
Stockholm during the year, millions 363.3 363.3 316.4 362.7 371.3 479.6 391.2 344.4 349.4 404.8 498.0
Number of shares traded in
ADR, NASDAQ during the year, millions 19.0 73.5 83.0 51.8 50.5 54.9 16.0 15.0 11.0 10.4 24.0
1Effective in 1997, adjustment was made to conform with the Swedish
Financial Accounting Standard Council’s recommendation, RR9, Income
Taxes. Income per share is calculated as net income divided by average
number of shares outstanding.
2 Proposed dividend in SEK per share divided by share price at year-end,
including distribution of shares in Ainax equal to SEK 15.05 per Volvo share
in 2004.
3 Share price at year-end, including proposed dividend during the year, divided
by share price at beginning of the year, including redemption in 1997 and
distribution of one share of Swedish Match 1996 and proposed distribution
of shares in Ainax in 2003.
4Share price at year-end divided by income per share.
5Market value at year-end minus net financial position and minority interests
divided by operating income excluding restructuring costs and revaluation of
shares.
6Cash dividend divided by income per share.
7Shareholders’ equity divided by number of shares outstanding at year-end.
8Plus one share of Swedish Match per Volvo share, price of SEK 21.74
(weighted average first ten trading days following listing).
9Proposed by the Board of Directors.
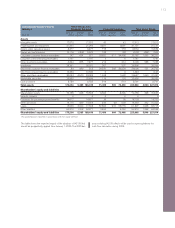
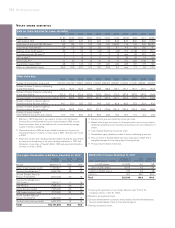
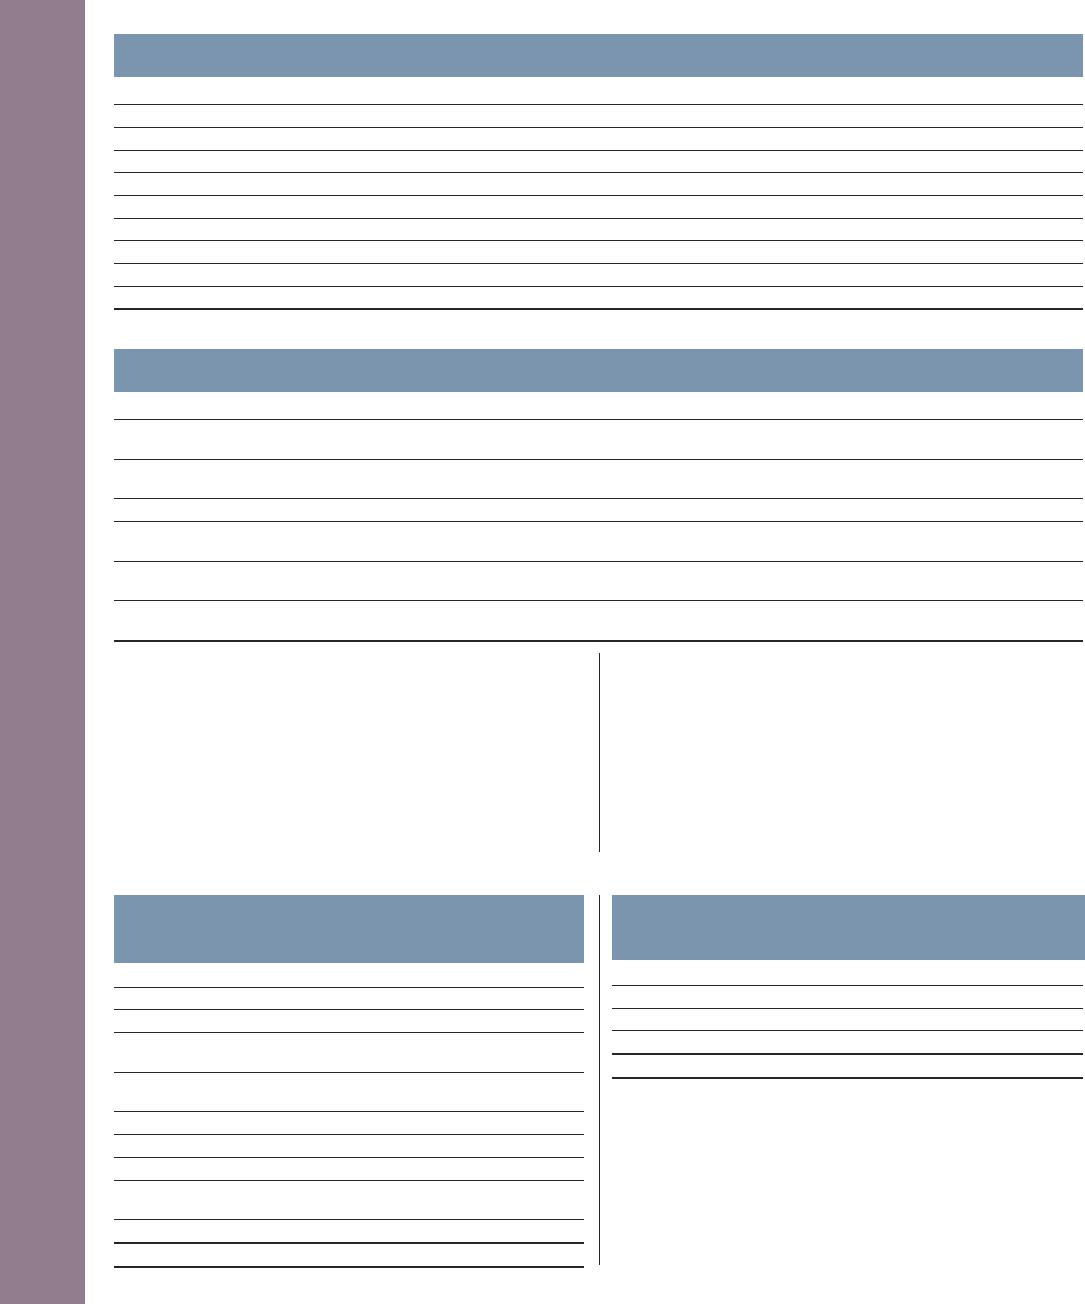
VOLVO SHARE STATISTICS
Distribution of shares, December 31, 2004
Number of % of Share of
Volvo shareholders1holding shareholders total votes 2capital, % 2
1–1,000 shares 191,532 6.1 6.8
1,001–10,000 shares 9,815 4.3 5.4
10,001–100,000 shares 735 3.5 4.8
100,001– 267 86.0 83.0
Total 202,349 100.0 100.0
The largest shareholders in AB Volvo, December 31, 2004 1
Number % of Share
of shares total votes 2capital, % 2
Renault 88,304,177 20.0 20.0
Robur fonder (savings funds) 11,663,821 4.4 2.6
Svenska Handelsbanken 38,265,786 4.8 1.9
Second Swedish National
Pension Fund (AP2) 8,070,208 3.9 1.8
Svenska Handelsbanken/
SPP fonder 47,943,217 1.1 1.8
AMF Pension 7,286,100 2.9 1.7
Alecta (pension funds) 7,245,009 2.6 1.6
SEB fonder (savings funds) 7,073,200 3.4 1.6
Fourth Swedish National
Pension Fund (AP4) 6,683,095 2.2 1.5
Nordea fonder (savings funds) 5,607,279 1.2 1.3
Total 158,141,892 46.5 35.8
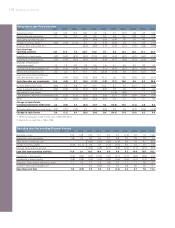
Data per share (adjusted for issues and splits) 1
1994 1995 1996 1997 1998 1999 2000 2001 2002 2003 2004
Income, SEK 131.80 20.20 26.90 23.20 19.10 73.00 11.20 (3.50) 3.32 0.71 22.35
Cash dividend, SEK 3.40 4.00 84.30 5.00 6.00 7.00 8.00 8.00 8.00 8.00 12.509
Share price at year-end, SEK (B share) 140 136 151 213 186 220 156.50 176 142 220 263.50
Direct return, % (B share) 22.4 2.9 2.9 2.3 3.2 3.2 5.1 4.5 5.6 10.5 4.7
Effective return, % (B share) 332 0 30 46 (10) 22 (23) 17.6 (14.8) 71.2 25.4
Price/earnings ratio (B share) 447699314neg4331011.8
EBIT multiple 5771691110102523149.4
Payout ratio, % 611 20 16 22 31 10 71 neg 242 1,143 56
Shareholders’ equity, SEK 798 110 125 140 157 221 222 203 187 173 169
Return on shareholders’ equity 36.5 19.3 23.7 17.2 13.0 34.9 5.0 neg 1.7 0.4 13.2
1 Following the repurchase of own shares, AB Volvo held 7.1% of the
Company’s shares on Dec 31, 2004.
2 Based on all registered shares.
3 Svenska Handelsbanken comprises shares held by Svenska Handelsbanken,
Svenska Handelsbanken Pension Fund and Oktogonen.
4 Savings and pension funds.