Volvo 2004 Annual Report Download - page 6
Download and view the complete annual report
Please find page 6 of the 2004 Volvo annual report below. You can navigate through the pages in the report by either clicking on the pages listed below, or by using the keyword search tool below to find specific information within the annual report.-
 1
1 -
 2
2 -
 3
3 -
 4
4 -
 5
5 -
 6
6 -
 7
7 -
 8
8 -
 9
9 -
 10
10 -
 11
11 -
 12
12 -
 13
13 -
 14
14 -
 15
15 -
 16
16 -
 17
17 -
18
-
19
-
20
-
21
-
22
-
23
-
24
-
25
-
26
-
27
-
28
-
29
-
30
-
31
-
32
-
33
-
34
-
35
-
36
-
37
-
38
-
39
-
40
-
41
-
42
-
43
-
44
-
45
-
46
-
47
-
48
-
49
-
50
-
51
-
52
-
53
-
54
-
55
-
56
-
57
-
58
-
59
-
60
-
61
-
62
-
63
-
64
-
65
-
66
-
67
-
68
-
69
-
70
-
71
-
72
-
73
-
74
-
75
-
76
-
77
-
78
-
79
-
80
-
81
-
82
-
83
-
84
-
85
-
86
-
87
-
88
-
89
-
90
-
91
-
92
-
93
-
94
-
95
-
96
-
97
-
98
-
99
-
100
-
101
-
102
-
103
-
104
-
105
-
106
-
107
-
108
-
109
-
110
-
111
-
112
-
113
-
114
-
115
-
116
-
117
-
118
-
119
-
120
-
121
-
122
-
123
-
124
-
125
-
126
-
127
-
128
 |
 |

4The Volvo share
THE VOLVO
SHARE
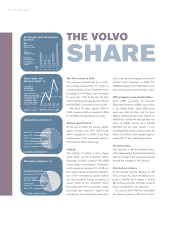
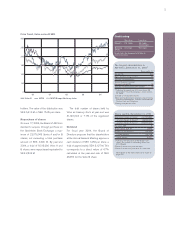
The Volvo share in 2004
The year was characterized by a contin-
ued positive development for equity on
markets globally. On the Stockholm Stock
Exchange, the All-Share Index increased
by more than 17%. In the US, the Dow
Jones Industrial Average gained 3% and
the NASDAQ Composite closed up 9%.
The Volvo B share gained 23% in
2004, compared with an increase of 26%
for the MSCI Europe Machinery Index.
Market capitalization
At the end of 2004, the market capital-
ization of Volvo was SEK 106,754 M,
which corresponds to 4.0% of the total
market value of the companies listed on
the Stockholm Stock Exchange.
Trading
The majority of trading in Volvo shares
takes place via the Stockholm Stock
Exchange. In 2004, a total of 540 (436)
million shares were traded in Stockholm,
which equals an average of 2.1 (1.8) mil-
lion shares traded per day. The deregula-
tion of the international capital markets
and the increased foreign ownership of
shares listed on the Stockholm Stock
Exchange have led to secondary listings
becoming less important. Against this
background, Volvo delisted its share from
the London Stock Exchange and from the
German stock exchanges in 2004. The
NASDAQ listing in the United States is the
only remaining secondary listing for Volvo.
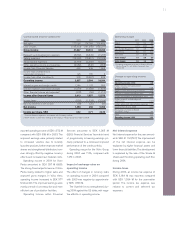
ADR program in the United States
Since 1985, a program for American
Depositary Receipts (ADRs) has existed
in the United States. Each ADR repre-
sents one Volvo B share and the Volvo
ADR is traded with the ticker VOLVY on
NASDAQ. In 2004, the average daily vol-
umes of ADRs traded were 94,695
(40,729) and the total number of out-
standing ADRs at year-end was about 20
million (10 million), which equalled approx-
imately 5% of the outstanding shares.
Dividend policy
The objective is that the effective return
to the shareholders, the dividend combined
with the change in the share price, should
exceed the average for the industry.
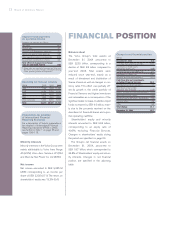
Distribution of Ainax
At the Annual General Meeting of AB
Volvo on April 16, 2004, the Board’s pro-
posal to transfer all A shares in Scania
AB to Ainax and then distribute Ainax to
Volvo’s shareholders was approved.
On June 8, 2004, AB Volvo distributed
the shares in Ainax to AB Volvo's share-
11.2 3.1 3.3 9.1
8.0 8.0 8.0 8.0
5.1Direct return* 4.5 5.6 10.5
(23)Effective return** 17.6 (14.8) 71.2
Net income* and cash dividend
per share
Net income*,
SEK per share
Dividend,
SEK per share
* Excluding
restructuring
costs and
revaluation of
shares.
00 01 02 03 04
00 01 02 03 04
Direct return* and
effective return**, %
* Dividend as
percentage
of share price
** Share price at
year-end, including
dividend proposed
during the year,
divided by share
price atthe begin-
ning of the year.
Sweden (48)
France (21)
US (13)
UK (9)
Luxemburg (2)
Others (7)
* of capital, re
g
istered share
s
* of capital, registered shares
Ownership categories*, %
Non-Swedish owners
(
52
)
Saving funds (10)
Pension funds and
insurance compa-
nies (13)
Private share-
holdings (11)
Others (14)
Ownership by country*, %
20.4
12.5
4.7
25.4
0