Volvo 2004 Annual Report Download - page 16
Download and view the complete annual report
Please find page 16 of the 2004 Volvo annual report below. You can navigate through the pages in the report by either clicking on the pages listed below, or by using the keyword search tool below to find specific information within the annual report.-
 1
1 -
2
-
3
-
4
-
5
-
 6
6 -
 7
7 -
 8
8 -
 9
9 -
 10
10 -
 11
11 -
 12
12 -
 13
13 -
 14
14 -
 15
15 -
 16
16 -
 17
17 -
 18
18 -
 19
19 -
 20
20 -
 21
21 -
 22
22 -
 23
23 -
 24
24 -
 25
25 -
 26
26 -
27
-
28
-
29
-
30
-
31
-
32
-
33
-
34
-
35
-
36
-
37
-
38
-
39
-
40
-
41
-
42
-
43
-
44
-
45
-
46
-
47
-
48
-
49
-
50
-
51
-
52
-
53
-
54
-
55
-
56
-
57
-
58
-
59
-
60
-
61
-
62
-
63
-
64
-
65
-
66
-
67
-
68
-
69
-
70
-
71
-
72
-
73
-
74
-
75
-
76
-
77
-
78
-
79
-
80
-
81
-
82
-
83
-
84
-
85
-
86
-
87
-
88
-
89
-
90
-
91
-
92
-
93
-
94
-
95
-
96
-
97
-
98
-
99
-
100
-
101
-
102
-
103
-
104
-
105
-
106
-
107
-
108
-
109
-
110
-
111
-
112
-
113
-
114
-
115
-
116
-
117
-
118
-
119
-
120
-
121
-
122
-
123
-
124
-
125
-
126
-
127
-
128
 |
 |

14 Board of Directors’ Report
CASH-FLOW STATEMENT
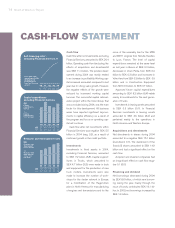
Cash flow
Cash flow after net investments, excluding
Financial Services, amounted to SEK 26.4
billion. Operating cash flow (excluding the
effects of acquisitions and divestments)
was SEK 11.4 billion. The positive devel-
opment during 2004 was mostly related
to an increase in profitability. Working cap-
ital increased somewhat compared to last
year due to strong sales growth. However,
the negative effects of the growth were
reduced by increased working capital
turnover. The successful capital rationali-
zation project within the Volvo Group, that
was concluded during 2004, was the main
factor for this development. All business
areas have reported significant improve-
ments in capital efficiency as a result of
the program and focus on operating cap-
ital will continue.
Cash flow after net investments within
Financial Services was negative SEK 5.5
billion in 2004 (neg. 3.2), as a result of
continued growth in the credit portfolio.
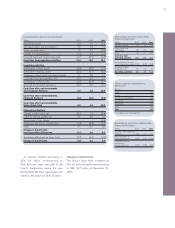
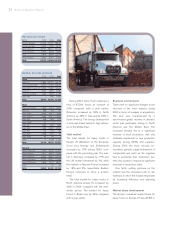
Investments
Investments in fixed assets in 2004,
excluding Financial Services, amounted
to SEK 7.2 billion (5.8). Capital expend-
itures in Trucks, which amounted to
SEK4.7 billion (3.9), were made in tools
and equipment for the production of new
truck models. Investments were also
made to increase the number of work-
shops for the dealer network in Europe,
for a modification of the Hagerstown
plant in North America for manufacturing
of engines and transmissions and for the
move of the assembly line for the MD9
and MD11 engines from Skövde, Sweden,
to Lyon, France. The level of capital
expenditures remained at the same level
as last year in Buses at SEK 0.2 billion,
decreased in Volvo Penta from SEK 0.4
billion to SEK 0.3 billion and increased in
Volvo Aero from SEK 0.3 billion to SEK 0.5
billion and in Construction Equipment
from SEK 0.5 billion to SEK 0.7 billion.
Approved future capital expenditures
amounting to SEK 8.2 billion (6.4) relate
mainly to investments for the next gener-
ation of trucks.
Investments in leasing assets amounted
to SEK 0.3 billion (0.1). In Financial
Services investments in leasing assets
amounted to SEK 4.6 billion (5.2) and
pertained mainly to the operations in
North America and Western Europe.
Acquisitions and divestments
Net divestments in shares during 2004
amounted to a negative SEK 15.1 billion
(investment: 0.1). The divestment of the
Scania B shares amounted to SEK 14.9
billion and had a significant effect on the
cash flow.
Acquired and divested companies had
an insignificant effect on cash flow nega-
tive 0.1 (0.0).
Financing and dividend
Net borrowings decreased during 2004
by SEK 8.8 billion, of which new borrow-
ing during the year, mainly through the
issue of bonds, contributed SEK 19.1 bil-
lion. In 2003, net borrowings increased by
SEK 1.9 billion.
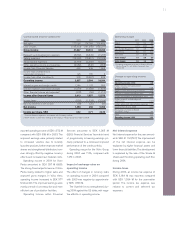
00 01 03 0402
Self-financing ratio*,
excluding Financial Services, %
72 137 196 243 266
00 01 03 04
6.3 8.4 6.8
02
6.2
Capital expenditures
excluding Financial Services
Capital
expenditures,
SEK bn
Capital
expenditures,
% of net sales
5.3 4.6 3.8 3.6
00 01 03 04
4.9 5.4 5.9
02
6.8
Research and development costs
3.7 2.8 3.2 3.7
Research and
development
costs, SEK bn
Research and
development
costs, % of
net sales
7.2
3.6
7.7
3.8
* Cash flow from
operating activities
divided by net
investments in
fixed and leasing
assets.