Volvo 2004 Annual Report Download - page 18
Download and view the complete annual report
Please find page 18 of the 2004 Volvo annual report below. You can navigate through the pages in the report by either clicking on the pages listed below, or by using the keyword search tool below to find specific information within the annual report.-
 1
1 -
2
-
3
-
4
-
5
-
6
-
7
-
 8
8 -
 9
9 -
 10
10 -
 11
11 -
 12
12 -
 13
13 -
 14
14 -
 15
15 -
 16
16 -
 17
17 -
 18
18 -
 19
19 -
 20
20 -
 21
21 -
 22
22 -
 23
23 -
 24
24 -
 25
25 -
 26
26 -
 27
27 -
 28
28 -
29
-
30
-
31
-
32
-
33
-
34
-
35
-
36
-
37
-
38
-
39
-
40
-
41
-
42
-
43
-
44
-
45
-
46
-
47
-
48
-
49
-
50
-
51
-
52
-
53
-
54
-
55
-
56
-
57
-
58
-
59
-
60
-
61
-
62
-
63
-
64
-
65
-
66
-
67
-
68
-
69
-
70
-
71
-
72
-
73
-
74
-
75
-
76
-
77
-
78
-
79
-
80
-
81
-
82
-
83
-
84
-
85
-
86
-
87
-
88
-
89
-
90
-
91
-
92
-
93
-
94
-
95
-
96
-
97
-
98
-
99
-
100
-
101
-
102
-
103
-
104
-
105
-
106
-
107
-
108
-
109
-
110
-
111
-
112
-
113
-
114
-
115
-
116
-
117
-
118
-
119
-
120
-
121
-
122
-
123
-
124
-
125
-
126
-
127
-
128
 |
 |

16 Board of Directors’ Report
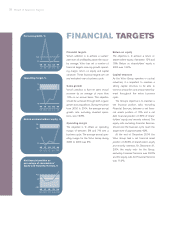
FINANCIAL TARG ETS
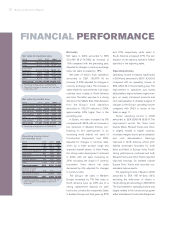
Financial targets
Volvo’s ambition is to achieve a sustain-
able level of profitability above the indus-
try average. Volvo has set a number of
financial targets covering growth, operat-
ing margin, return on equity and capital
structure. These financial targets are set
and evaluated over a business cycle.
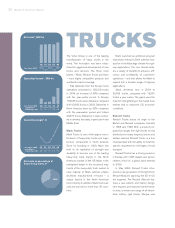
Sales growth
Volvo’s ambition is that net sales should
increase by an average of more than
10% on an annual basis. This objective
should be achieved through both organic
growth and acquisitions. During the period
from 2000 to 2004, the average annual
growth rate, excluding divested opera-
tions, was 13.8%.
Operating margin
The objective is to obtain an operating
margin of between 5% and 7% over a
business cycle. The average annual oper-
ating margin for the Volvo Group during
2000 to 2004 was 3%.
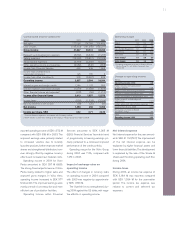
Return on equity
The objective is to achieve a return on
shareholders’ equity of between 12% and
15%. Return on shareholders' equity in
2004 was 13.2%.
Capital structure
As the Volvo Group operates in cyclical
industries, it is important to maintain a
strong capital structure to be able to
invest in production and product develop-
ment throughout the entire business
cycle.
The Group’s objective is to maintain a
net financial position ratio, excluding
Financial Services, between a net finan-
cial assets position of 15% and a net
debt financial position of 30% of share-
holders’ equity and minority interest. The
equity ratio excluding Financial Services,
should over the business cycle reach the
target level of approximately 40%.
At the end of December 2004, the
Volvo Group had a net financial asset
position of 26.8% of shareholders’ equity
and minority interests. On December 31,
2004, the equity ratio for the Group,
excluding Financial Services, was 40.0%
and the equity ratio for Financial Services
was 11.6%.
00 01 03
350 (2)
02
(1)
Net sales growth, %
0
10
04
15
00 01 03
5.5 (0.4) 1.6
02
1.4
Operating margin, %
0
7
5
04
7.0
00 01 03
5.0 (1.7) 1.7
02
0.4
Return on shareholders’ equity, %
0
15
12
04
13.2
00 01 03
10.6 (8.2) (7.7)
02
(3.3)
Net financial position as
percentage of shareholders’
equity and minority interests, %
15
0
–30
04
26.8