Volvo 2004 Annual Report Download - page 89
Download and view the complete annual report
Please find page 89 of the 2004 Volvo annual report below. You can navigate through the pages in the report by either clicking on the pages listed below, or by using the keyword search tool below to find specific information within the annual report.-
 1
1 -
2
-
3
-
4
-
5
-
6
-
7
-
8
-
9
-
10
-
11
-
12
-
13
-
14
-
15
-
16
-
17
-
18
-
19
-
20
-
21
-
22
-
23
-
24
-
25
-
26
-
27
-
28
-
29
-
30
-
31
-
32
-
33
-
34
-
35
-
36
-
37
-
38
-
39
-
40
-
41
-
42
-
43
-
44
-
45
-
46
-
47
-
48
-
49
-
50
-
51
-
52
-
53
-
54
-
55
-
56
-
57
-
58
-
59
-
60
-
61
-
62
-
63
-
64
-
65
-
66
-
67
-
68
-
69
-
70
-
71
-
72
-
73
-
74
-
75
-
76
-
77
-
78
-
 79
79 -
 80
80 -
 81
81 -
 82
82 -
 83
83 -
 84
84 -
 85
85 -
 86
86 -
 87
87 -
 88
88 -
 89
89 -
 90
90 -
 91
91 -
 92
92 -
 93
93 -
 94
94 -
 95
95 -
 96
96 -
 97
97 -
 98
98 -
 99
99 -
100
-
101
-
102
-
103
-
104
-
105
-
106
-
107
-
108
-
109
-
110
-
111
-
112
-
113
-
114
-
115
-
116
-
117
-
118
-
119
-
120
-
121
-
122
-
123
-
124
-
125
-
126
-
127
-
128
 |
 |
87
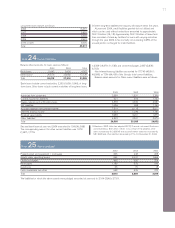
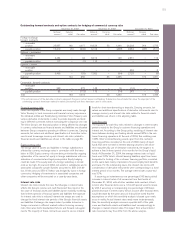
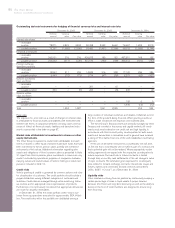
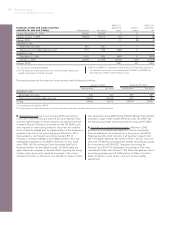
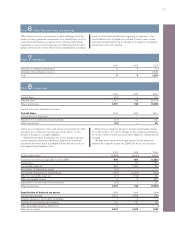
Fair value of Volvo’s financial instruments 1
December 31, 2002 December 31, 2003 December 31, 2004
Carrying Fair Carrying Fair Carrying Fair
value value value value value value
Assets
Investments in shares and participations
fair value determinable 225,220 15,537 21,217 18,798 670 169
fair value not determinable 3615 – 626 – 420 –
Customer-financing receivables 46,998 47,508 46,002 46,244 51,193 51,948
Other loans to external parties and other
interest-bearing receivables 4,807 4,735 6,483 6,623 3,047 3,075
Marketable securities 16,707 16,659 19,529 19,518 25,955 25,955
Total 94,347 84,439 93,857 91,183 81,285 81,147
Liabilities
Long-term bond loans and other loans 46,419 48,282 46,674 48,175 40,411 41,684
Short-term bank loans and other loans 26,018 26,083 27,418 27,655 21,396 21,584
Total 72,437 74,365 74,092 75,830 61,807 63,268
Derivative instruments
Outstanding derivative contracts for hedging
of commercial currency risks 144 855 53 1,335 176 1,371
Outstanding commodity contracts – 159 – 5 – (25)
Outstanding derivative contracts for hedging
of financial currency risks and interest rate risks 1,394 1,987 1,961 2,589 252 924
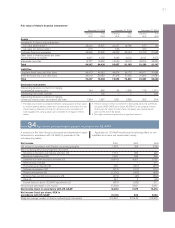
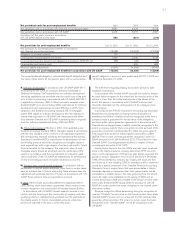
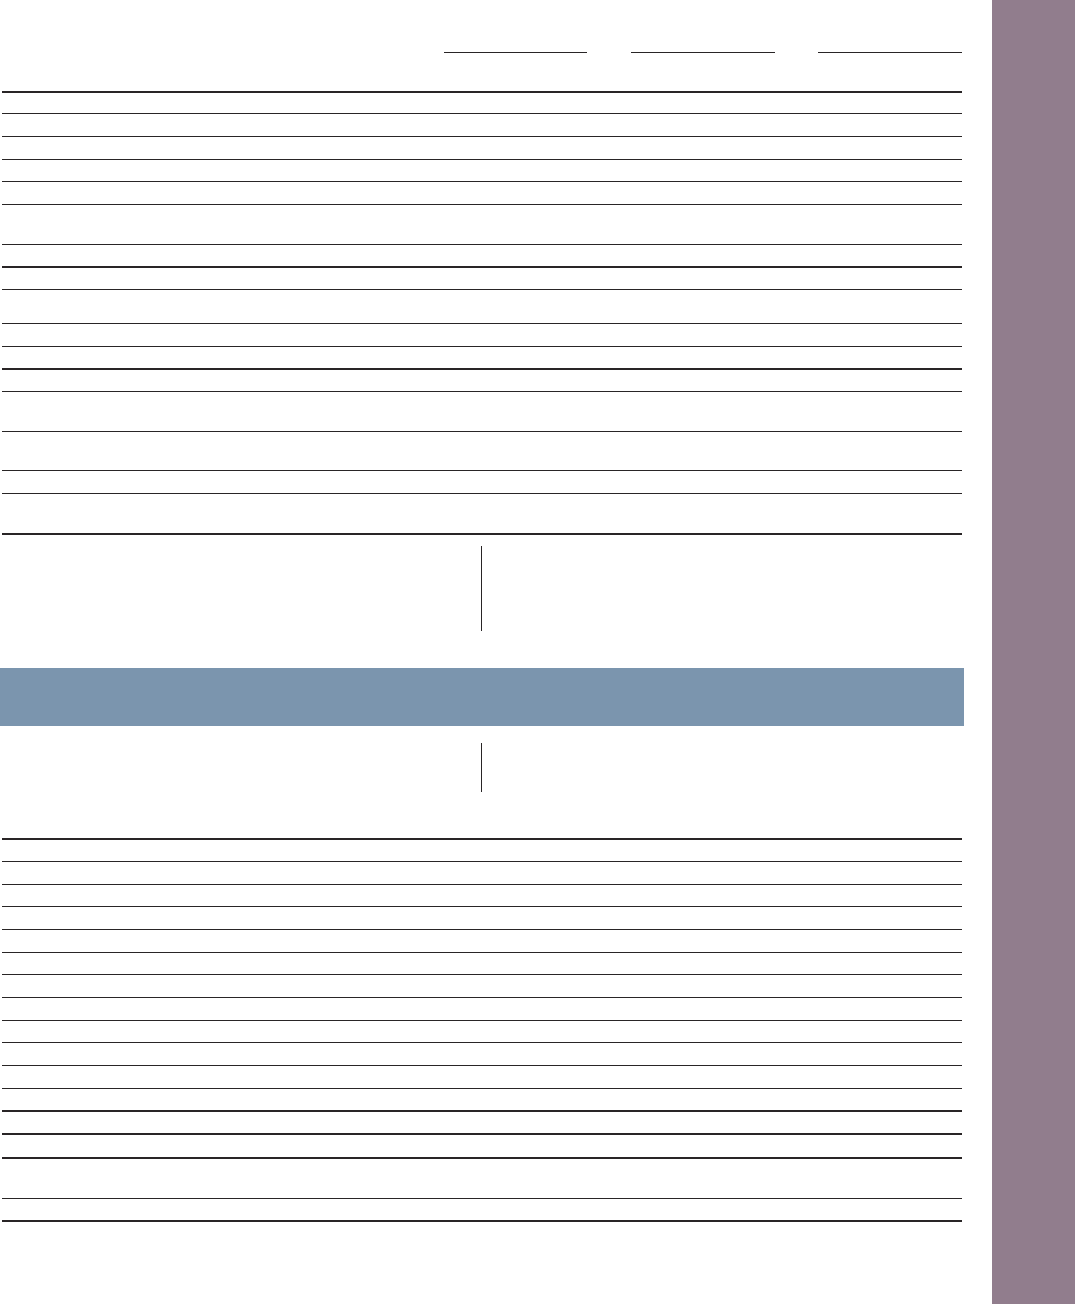
Note 34Net income and shareholders’ equity in accordance with US GAAP
A summary of the Volvo Group’s net income and shareholders’ equity
determined in accordance with US GAAP, is presented in the
accompanying tables.
Application of US GAAP would have the following effect on con-
solidated net income and shareholders’ equity:
Net income 2002 2003 2004
Net income in accordance with Swedish accounting principles 1,393 298 9,355
Items increasing (decreasing) reported net income
Derivative instruments and hedging activities (A) 1,772 882 228
Business combinations (B) 1,094 556 826
Investments in debt and equity securities (C) (9,616) 4,007 5,157
Restructuring costs (D) – – 311
Post-employment benefits (E) 669 (651) (273)
Software development (F) (212) (211) (119)
Product development (G) (1,236) (352) (828)
Entrance fees, aircraft engine programs (H) (219) (20) (392)
Other (I) 447 2 (60)
Income taxes on above US GAAP adjustments (J) (357) (532) 211
Net increase (decrease) in net income (7,658) 3,681 5,061
Net income (loss) in accordance with US GAAP (6,265) 3,979 14,416
Net income (loss) per share, SEK in
accordance with US GAAP (14.90) 9.50 34.44
Weighted average number of shares outstanding (in thousands) 419,445 419,445 418,529
1This table only includes a comparison between carrying values and fair values
for interest bearing balance sheet items and derivative instruments. For non
interest bearing financial instruments, such as accounts receivable and
trade payables, the carrying values are considered to be equal to the fair
values.
2Pertains mainly to Volvo’s investments in Scania AB, Deutz AG and Henlys
Group plc 2002–2003 and in Deutz AG 2004. For the purpose of these
disclosures, fair values of listed shares are based upon quoted market
prices at the end of the period.
3No single investment represents any significant amount.