Volvo 2004 Annual Report Download - page 67
Download and view the complete annual report
Please find page 67 of the 2004 Volvo annual report below. You can navigate through the pages in the report by either clicking on the pages listed below, or by using the keyword search tool below to find specific information within the annual report.-
 1
1 -
2
-
3
-
4
-
5
-
6
-
7
-
8
-
9
-
10
-
11
-
12
-
13
-
14
-
15
-
16
-
17
-
18
-
19
-
20
-
21
-
22
-
23
-
24
-
25
-
26
-
27
-
28
-
29
-
30
-
31
-
32
-
33
-
34
-
35
-
36
-
37
-
38
-
39
-
40
-
41
-
42
-
43
-
44
-
45
-
46
-
47
-
48
-
49
-
50
-
51
-
52
-
53
-
54
-
55
-
56
-
 57
57 -
 58
58 -
 59
59 -
 60
60 -
 61
61 -
 62
62 -
 63
63 -
 64
64 -
 65
65 -
 66
66 -
 67
67 -
 68
68 -
 69
69 -
 70
70 -
 71
71 -
 72
72 -
 73
73 -
 74
74 -
 75
75 -
 76
76 -
 77
77 -
78
-
79
-
80
-
81
-
82
-
83
-
84
-
85
-
86
-
87
-
88
-
89
-
90
-
91
-
92
-
93
-
94
-
95
-
96
-
97
-
98
-
99
-
100
-
101
-
102
-
103
-
104
-
105
-
106
-
107
-
108
-
109
-
110
-
111
-
112
-
113
-
114
-
115
-
116
-
117
-
118
-
119
-
120
-
121
-
122
-
123
-
124
-
125
-
126
-
127
-
128
 |
 |
65
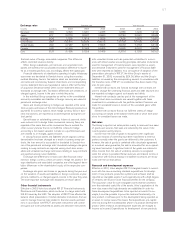
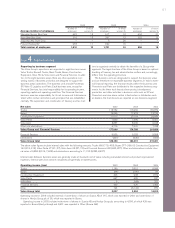
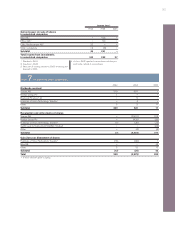
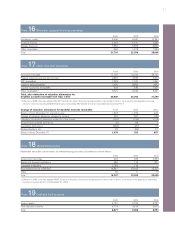
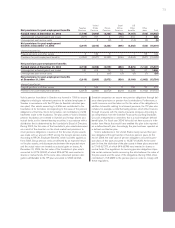
Note 7Income from other investments
2002 2003 2004
Dividends received
Scania AB 319 501 –
Henlys Group Plc 77–
Diamond Finance, Ltd –5–
Holdings of Volvo Technology Transfer1–4–
Other 3311
Subtotal 329 520 11
Revaluation and write downs of shares
Scania AB –(3,601) 915
Henlys Group Plc –(429) (95)
Holdings of Volvo Technology Transfer1(7) (39) (13)
Smith Land & Improvement (SABA Holding) – – (22)
Other –(4) (8)
Subtotal (7) (4,073) 777
Gain (loss) on divestment of shares
Holdings of Volvo Technology Transfer1(16) (36) 1
Bilia AB ––24
Other 31017
Subtotal (13) (26) 42
Total 309 (3,579) 830
1A Volvo venture-capital company.
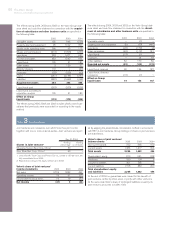
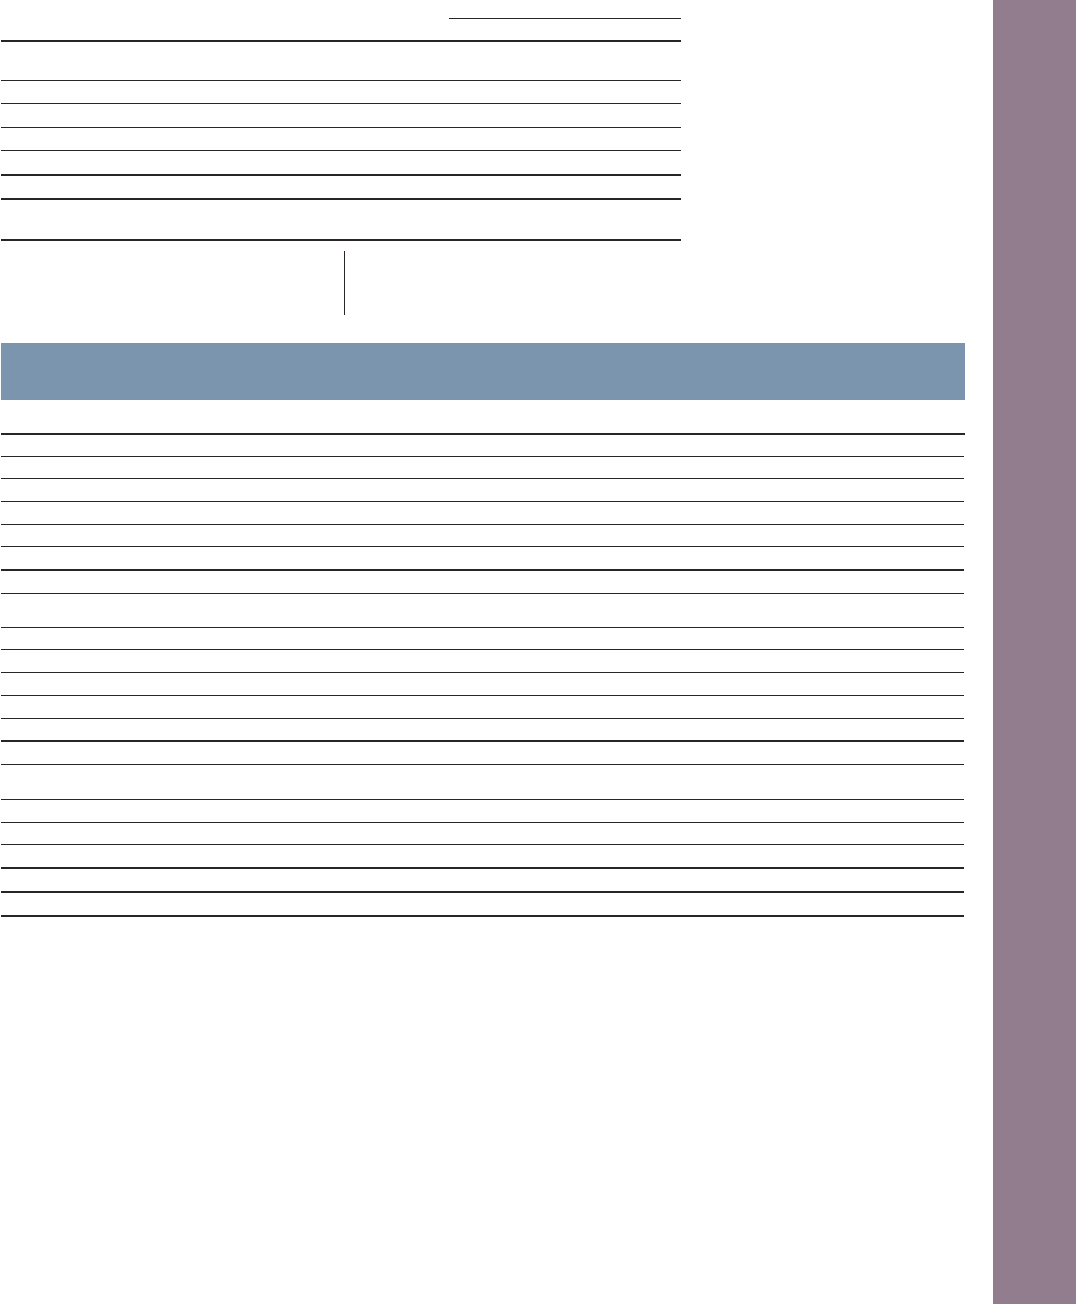
Income (loss)
2002 2003 2004
Gains (losses) on sale of shares
in associated companies
Bilia AB 3–188 –
Effero AB 2–59 –
Eddo Restauranger AB 132 – –
Other companies 12 (6) –
Subtotal 44 241 –
Total income from investments
in associated companies 182 200 27
4As from 2003 reported in accordance with the pro-
portionate method of consolidation.
1Divested in 2002.
2Divested in 2003.
3Main part of holding divested in 2003, remaining part
divested in 2004.