Volvo 2004 Annual Report Download - page 12
Download and view the complete annual report
Please find page 12 of the 2004 Volvo annual report below. You can navigate through the pages in the report by either clicking on the pages listed below, or by using the keyword search tool below to find specific information within the annual report.-
 1
1 -
 2
2 -
 3
3 -
 4
4 -
 5
5 -
 6
6 -
 7
7 -
 8
8 -
 9
9 -
 10
10 -
 11
11 -
 12
12 -
 13
13 -
 14
14 -
 15
15 -
 16
16 -
 17
17 -
 18
18 -
 19
19 -
 20
20 -
 21
21 -
 22
22 -
23
-
24
-
25
-
26
-
27
-
28
-
29
-
30
-
31
-
32
-
33
-
34
-
35
-
36
-
37
-
38
-
39
-
40
-
41
-
42
-
43
-
44
-
45
-
46
-
47
-
48
-
49
-
50
-
51
-
52
-
53
-
54
-
55
-
56
-
57
-
58
-
59
-
60
-
61
-
62
-
63
-
64
-
65
-
66
-
67
-
68
-
69
-
70
-
71
-
72
-
73
-
74
-
75
-
76
-
77
-
78
-
79
-
80
-
81
-
82
-
83
-
84
-
85
-
86
-
87
-
88
-
89
-
90
-
91
-
92
-
93
-
94
-
95
-
96
-
97
-
98
-
99
-
100
-
101
-
102
-
103
-
104
-
105
-
106
-
107
-
108
-
109
-
110
-
111
-
112
-
113
-
114
-
115
-
116
-
117
-
118
-
119
-
120
-
121
-
122
-
123
-
124
-
125
-
126
-
127
-
128
 |
 |

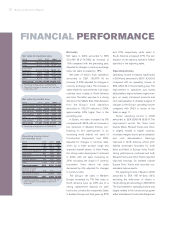
10 Board of Directors’ Report
Net sales by business area
SEKM 2002 2003 2004 %1
Trucks 118,752 116,969 136,879 +17
Buses 14,035 11,978 12,722 +6
Construction
Equipment 21,012 23,154 28,685 +24
Volvo Penta 7,669 7,596 9,057 +19
Volvo Aero 8,837 8,030 6,925 (14)
Other 6,775 7,041 7,228 +3
Volvo Group2177,080 174,768 201,496 +15
1Percentage change pertains to 2004/2003.
2Adjusted for changes in currency rates, net sales
increased by 18%.
Net sales by market area
SEKM 2002 2003 2004 %1
Western Europe 92,331 95,775 102,498 +7
Eastern Europe 7,437 8,344 10,556 +27
North America 50,206 42,043 51,751 +23
South America 4,667 4,727 6,949 +47
Asia 12,644 15,754 20,699 +31
Other markets 9,795 8,125 9,043 +11
Volvo Group 177,080 174,768 201,496 +15
1Percentage change pertains to 2004/2003.
Operating income (loss)
by business area
SEKM 2002 2003 2004
Trucks 1,189 3,951 8,989
Buses (94) (361) 185
Construction Equipment 406 908 1,572
Volvo Penta 647 695 937
Volvo Aero 5 (44) 377
Financial Services 490 926 1,365
Other (125) (42) (45)
Operating income12,518 6,033 13,380
Dividend received
from Scania AB 319 501 0
Revaluation of shares – (4,030) 820
Operating income 2,837 2,504 14,200
1 Excluding revaluation of shares in Scania AB and
Henlys Group Plc and dividend received from
Scania AB.
Net sales
Net sales in 2004 amounted to SEK
201,496 M (174,768), an increase of
15% compared with the preceding year.
Adjusted for changes in currency exchange
rates, net sales increased by 18%.
Net sales of Volvo’s truck operations
amounted to SEK 136,879 M, an
increase of 20% adjusted for changes in
currency exchange rates. The increase in
sales related to improvements in all major
markets, most notably in North America
and Asia. The latter was due to a strong
demand in the Middle East. Total deliveries
from the Group’s truck operations
amounted to 193,219 vehicles in 2004,
approximately 24% higher than in the
preceding year.
In Buses, net sales increased by 6%
compared with 2003, with an increase in
bus deliveries in Western Europe con-
tributing to this development. In an
increasing world market, net sales of
Construction Equipment rose 28%,
adjusted for changes in currency rates,
driven by a wider product range and
improved market shares. In Volvo Penta,
the strong sales development continued
in 2004, with net sales increasing by
24%, excluding the impact of currency
translation. Volvo Aero’s net sales
decreased by 6%, adjusted for changes
in currency rates.
The Group’s net sales in Western
Europe increased by 7%. Net sales in
North America were up 23% due to a
strong replacement demand for both
trucks and construction equipment. Sales
in Eastern Europe and Asia grew by 27%
and 31% respectively while sales in
South America increased 47%. The dis-
tribution of net sales by market is further
specified in the adjoining table.
Operating income
Operating income increased significantly
in 2004 and amounted to SEK 14,200 M,
compared with an operating income of
SEK 2,504 M in the preceding year. The
improvement in operations was mainly
attributable to higher volumes, higher mar-
gins on newly introduced products and
cost rationalization. A detailed analysis of
changes in the Group’s operating income
compared with 2003 is shown in the
table on page 11.
Trucks’ operating income in 2004
amounted to SEK 8,989 M (3,951). The
improvement across the three truck
brands, Mack, Renault Trucks and Volvo,
is largely related to higher volumes,
increased margins due to price realization
and cost rationalization. Earnings
improved in North America, where prof-
itability developed favorably for both
Volvo and Mack. In Europe, Volvo Trucks’
strong performance continued and both
Renault Trucks and Volvo Trucks reported
improved earnings. On markets outside
Europe Volvo Trucks also recorded con-
siderable improvements.
The operating income in Buses in 2004
amounted to SEK 185 M (loss: 361),
excluding the write-down of shares in
Henlys Group plc. amounting to SEK 95 M.
The improvement in operating income was
largely related to the turnaround program
within Volvo Buses. Construction Equipment
FINANCIAL PERFORMANCE