Volvo 2004 Annual Report Download - page 76
Download and view the complete annual report
Please find page 76 of the 2004 Volvo annual report below. You can navigate through the pages in the report by either clicking on the pages listed below, or by using the keyword search tool below to find specific information within the annual report.-
 1
1 -
2
-
3
-
4
-
5
-
6
-
7
-
8
-
9
-
10
-
11
-
12
-
13
-
14
-
15
-
16
-
17
-
18
-
19
-
20
-
21
-
22
-
23
-
24
-
25
-
26
-
27
-
28
-
29
-
30
-
31
-
32
-
33
-
34
-
35
-
36
-
37
-
38
-
39
-
40
-
41
-
42
-
43
-
44
-
45
-
46
-
47
-
48
-
49
-
50
-
51
-
52
-
53
-
54
-
55
-
56
-
57
-
58
-
59
-
60
-
61
-
62
-
63
-
64
-
65
-
 66
66 -
 67
67 -
 68
68 -
 69
69 -
 70
70 -
 71
71 -
 72
72 -
 73
73 -
 74
74 -
 75
75 -
 76
76 -
 77
77 -
 78
78 -
 79
79 -
 80
80 -
 81
81 -
 82
82 -
 83
83 -
 84
84 -
 85
85 -
 86
86 -
87
-
88
-
89
-
90
-
91
-
92
-
93
-
94
-
95
-
96
-
97
-
98
-
99
-
100
-
101
-
102
-
103
-
104
-
105
-
106
-
107
-
108
-
109
-
110
-
111
-
112
-
113
-
114
-
115
-
116
-
117
-
118
-
119
-
120
-
121
-
122
-
123
-
124
-
125
-
126
-
127
-
128
 |
 |

74 The Volvo Group
Notes to consolidated financial statements
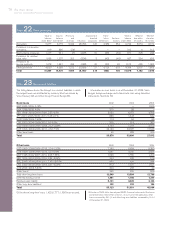
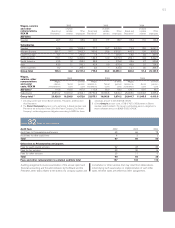
United Great US
Sweden States France Britain Other Other
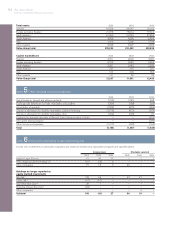
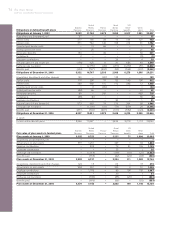
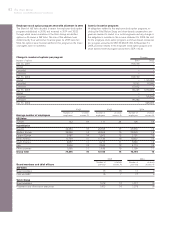
Fair value of plan assets in funded plans Pensions Pensions Pensions Pensions benefits plans Total
Plan assets at January 1, 2003 3,255 6,752 – 2,221 71 1,004 13,303
Acquisitions and divestments, net – ––––––
Actual return on plan assets 337 1,201 – 227 1 66 1,832
Employer contributions – 843 – 72 81 106 1,102
Employee contributions – – – 25 – 1 26
Exchange rate translation – (1,314) – (199) (18) (21) (1,552)
Benefits paid – (755) – (92) (24) (94) (965)
Plan assets at December 31, 2003 3,592 6,727 – 2,254 111 1,062 13,746
Acquisitions, divestments and other changes 129 15 – 114 – 18 276
Actual return on plan assets 358 691 – 224 2 51 1,326
Employer contributions – 1,153 – 83 106 105 1,447
Employee contributions – – – 30 – 1 31
Exchange rate translation – (730) – (55) (20) 1 (804)
Benefits paid – (693) – (98) – (92) (883)
Plan assets at December 31, 2004 4,079 7,163 – 2,552 199 1,146 15,139
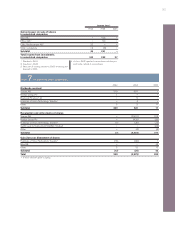
United Great US
Sweden States France Britain Other Other
Obligations in defined benefit plans Pensions Pensions Pensions Pensions benefits plans Total
Obligations at January 1, 2003 5,053 11,748 2,479 3,059 6,917 1,551 30,807
Acquisitions and divestments, net 37 – – – – – 37
Service costs 217 195 34 76 104 127 753
Interest costs 271 742 146 158 414 61 1,792
Unvested past service costs – 14 66 – – 1 81
Vested past service costs – 25 – – – 21 46
Termination benefits 130 – 32 – – 39 201
Curtailments 2––––(5)(3)
Employee contributions – – – 25 – 4 29
Actuarial gains (–) and losses (+) (156) 925 6 31 686 48 1,540
Exchange rate translation – (2,175) (26) (271) (1,279) (51) (3,802)
Benefits paid (222) (767) (404) (92) (564) (201) (2,250)
Obligations at December 31, 2003 5,332 10,707 2,333 2,986 6,278 1,595 29,231
Acquisitions, divestments and other changes 140 – (85) 138 – – 193
Service costs 176 206 19 82 193 136 812
Interest costs 280 668 115 172 348 72 1,655
Unvested past service costs – 3 (66) – – – (63)
Vested past service costs (46) 66 – – – 22 42
Termination benefits 88 – 205 – – 483 776
Curtailments (35) (5) - – – 35 (5)
Employee contributions – – – 30 – 1 31
Actuarial gains (–) and losses (+) 573 683 74 215 364 39 1,948
Exchange rate translation – (1,103) (19) (76) (576) 29 (1,745)
Benefits paid (271) (704) (497) (101) (532) (124) (2,229)
Obligations at December 31, 2004 6,237 10,521 2,079 3,446 6,075 2,288 30,646
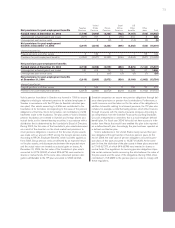
of which
Funded defined benefit plans 5,366 10,287 – 3,434 3,279 1,174 23,540