Volvo 2004 Annual Report Download - page 35
Download and view the complete annual report
Please find page 35 of the 2004 Volvo annual report below. You can navigate through the pages in the report by either clicking on the pages listed below, or by using the keyword search tool below to find specific information within the annual report.-
 1
1 -
2
-
3
-
4
-
5
-
6
-
7
-
8
-
9
-
10
-
11
-
12
-
13
-
14
-
15
-
16
-
17
-
18
-
19
-
20
-
21
-
22
-
23
-
24
-
 25
25 -
 26
26 -
 27
27 -
 28
28 -
 29
29 -
 30
30 -
 31
31 -
 32
32 -
 33
33 -
 34
34 -
 35
35 -
 36
36 -
 37
37 -
 38
38 -
 39
39 -
 40
40 -
 41
41 -
 42
42 -
 43
43 -
 44
44 -
 45
45 -
46
-
47
-
48
-
49
-
50
-
51
-
52
-
53
-
54
-
55
-
56
-
57
-
58
-
59
-
60
-
61
-
62
-
63
-
64
-
65
-
66
-
67
-
68
-
69
-
70
-
71
-
72
-
73
-
74
-
75
-
76
-
77
-
78
-
79
-
80
-
81
-
82
-
83
-
84
-
85
-
86
-
87
-
88
-
89
-
90
-
91
-
92
-
93
-
94
-
95
-
96
-
97
-
98
-
99
-
100
-
101
-
102
-
103
-
104
-
105
-
106
-
107
-
108
-
109
-
110
-
111
-
112
-
113
-
114
-
115
-
116
-
117
-
118
-
119
-
120
-
121
-
122
-
123
-
124
-
125
-
126
-
127
-
128
 |
 |

33
and 52% (61) of the total leasing was for
tenants outside the Volvo Group. 84% (76)
of the leases run for five years or more.
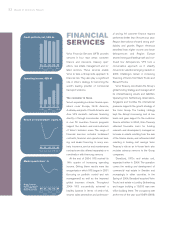
Volume and assets
The total volume of new retail financing in
2004 amounted to SEK 29.5 billion,
which was SEK 2.6 billion higher than
2003. For the year, Volvo Trucks account-
ed for 51% (54) of the volume,
Construction Equipment for 20% (17),
Renault Trucks for 17% (15), Buses for
4% (5) and Mack Trucks for 7% (8). The
remaining 1% (1) is mainly related to
Volvo Aero and Volvo Penta.
Total assets as of December 31, 2004
amounted to SEK 71.5 billion (67), of
which SEK 64 billion (60) was in the net
credit portfolio. Adjusted for the effects of
foreign exchange movements, the credit
portfolio grew by 10.8% during the year,
compared with growth of 7% during
2003. The credit portfolio consists of
50% Volvo Trucks, 18% Construction
Equipment, 16% Renault Trucks and 7%
Mack Trucks and 7% Buses. The remain-
ing 2% is mainly related to Volvo Aero and
Volvo Penta. From a currency perspective,
41.5% of the portfolio was denominated
in EUR, 30.4% in USD, 11.2% in GBP
and 5.2% CAD. The remaining 11.7% is a
mix of other European and Latin
American currencies.
In the markets where financial services
are offered, the average penetration dur-
ing the year was 28% for Volvo Trucks,
35% for Construction Equipment, 14%
for Buses, 17% for Renault Trucks and
11% for Mack Trucks. Expressed as an
average, Volvo Financial Services
financed 22% of the Group’s products
sold in the markets where financing is
offered, a decrease of 1.2 percentage
points from 2003.
Financial performance
In 2004 VFS strengthened its foundation
of controlled growth and improving prof-
itability. This was accomplished through
prudent credit granting and pricing in the
face of stiffening competition from banks
and other lenders.
VFS earned SEK 1,365 M in operating
income, up 47% from SEK 926 M report-
ed in 2003. Return on equity was 11.1%
(9.8) with a year-end equity ratio of
11.6% (12.0).
Write-offs in 2004 totalled SEK 429 M,
resulting in an annualized write-off ratio
for the year of 0.66% (1.37). Total credit
reserves amounted to SEK 1.3 billion at
the end of December, and the credit
reserve ratio at year-end was 2.08%.
Ambitions for 2005
The improving business climate and
rebound in capital spending gives VFS
optimism going into 2005. As competition
increases, VFS will pursue growth oppor-
tunities while maintaining the quality of
its pricing and credit decisions. Con-
servatively managing a healthy customer
finance portfolio remains the top priority.
VFS will also monitor the capital markets
to help ensure its funding costs remain
best in class.
In 2005 and beyond, VFS has plans to
increase its commercial focus and play an
increasing role in why new and retained
customers decide to acquire Volvo Group
products. With the know-how of its 1,100
employees, VFS has the ambition to
become a benchmark in the finance
industry. In the meanwhile, VFS is a solid
and dependable contributor to the Volvo
Group’s earnings.
Condensed income statement
SEKM 2002 2003 2004
Net sales 9,925 9,153 9,598
Income after
financial items 490 926 1,365
Income taxes (134) (170) (430)
Net income 356 756 935
Distribution of credit portfolio, net
%2002 2003 2004
Operational leasing 22 22 20
Financial leasing 25 26 25
Installment contracts 37 37 38
Dealer financing 16 13 16
Other customer credits 0 2 1