Rogers 2011 Annual Report Download - page 80
Download and view the complete annual report
Please find page 80 of the 2011 Rogers annual report below. You can navigate through the pages in the report by either clicking on the pages listed below, or by using the keyword search tool below to find specific information within the annual report.-
 1
1 -
2
-
3
-
4
-
5
-
6
-
7
-
8
-
9
-
10
-
11
-
12
-
13
-
14
-
15
-
16
-
17
-
18
-
19
-
20
-
21
-
22
-
23
-
24
-
25
-
26
-
27
-
28
-
29
-
30
-
31
-
32
-
33
-
34
-
35
-
36
-
37
-
38
-
39
-
40
-
41
-
42
-
43
-
44
-
45
-
46
-
47
-
48
-
49
-
50
-
51
-
52
-
53
-
54
-
55
-
56
-
57
-
58
-
59
-
60
-
61
-
62
-
63
-
64
-
65
-
66
-
67
-
68
-
69
-
 70
70 -
 71
71 -
 72
72 -
 73
73 -
 74
74 -
 75
75 -
 76
76 -
 77
77 -
 78
78 -
 79
79 -
 80
80 -
 81
81 -
 82
82 -
 83
83 -
 84
84 -
 85
85 -
 86
86 -
 87
87 -
 88
88 -
 89
89 -
 90
90 -
91
-
92
-
93
-
94
-
95
-
96
-
97
-
98
-
99
-
100
-
101
-
102
-
103
-
104
-
105
-
106
-
107
-
108
-
109
-
110
-
111
-
112
-
113
-
114
-
115
-
116
-
117
-
118
-
119
-
120
-
121
-
122
-
123
-
124
-
125
-
126
-
127
-
128
-
129
-
130
-
131
-
132
-
133
-
134
-
135
-
136
 |
 |

MANAGEMENT’S DISCUSSION AND ANALYSIS
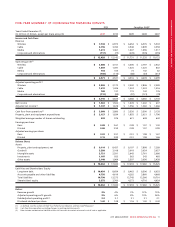
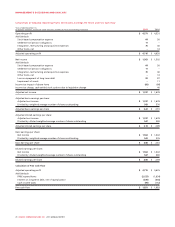
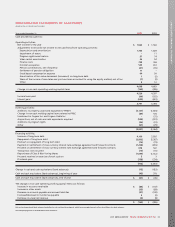
Calculations of Adjusted Operating Profit, Net Income, Earnings Per Share and Free Cash Flow
Years ended December 31,
(In millions of dollars, except per share amounts; number of shares outstanding in millions) 2011 2010
Operating profit $ 4,571 $ 4,531
Add (deduct):
Stock-based compensation expense 64 50
Settlement of pension obligations 11 –
Integration, restructuring and acquisition expenses 70 40
Other items, net –14
Adjusted operating profit $ 4,716 $ 4,635
Net income $ 1,563 $ 1,502
Add (deduct):
Stock-based compensation expense 64 50
Settlement of pension obligations 11 –
Integration, restructuring and acquisition expenses 70 40
Other items, net –14
Loss on repayment of long-term debt 99 87
Impairment of assets –11
Income tax impact of above items (60) (66)
Income tax charge, cash-settled stock options due to legislative change –40
Adjusted net income $ 1,747 $ 1,678
Adjusted basic earnings per share:
Adjusted net income $ 1,747 $ 1,678
Divided by: weighted average number of shares outstanding 543 576
Adjusted basic earnings per share $ 3.22 $ 2.91
Adjusted diluted earnings per share:
Adjusted net income $ 1,747 $ 1,678
Divided by: diluted weighted average number of shares outstanding 547 580
Adjusted diluted earnings per share $ 3.19 $ 2.89
Basic earnings per share:
Net income $ 1,563 $ 1,502
Divided by: weighted average number of shares outstanding 543 576
Basic earnings per share $2.88 $ 2.61
Diluted earnings per share:
Net income $ 1,563 $ 1,502
Divided by: diluted weighted average number of shares outstanding 547 580
Diluted earnings per share $2.86$ 2.59
Calculation of Free Cash Flow
Adjusted operating profit $ 4,716 $ 4,635
Add (deduct):
PP&E expenditures (2,127) (1,834)
Interest on long-term debt, net of capitalization (639) (666)
Cash income taxes (99) (152)
Free cash flow $1,851 $ 1,983
76 ROGERS COMMUNICATIONS INC. 2011 ANNUAL REPORT