Rogers 2011 Annual Report Download - page 34
Download and view the complete annual report
Please find page 34 of the 2011 Rogers annual report below. You can navigate through the pages in the report by either clicking on the pages listed below, or by using the keyword search tool below to find specific information within the annual report.-
 1
1 -
2
-
3
-
4
-
5
-
6
-
7
-
8
-
9
-
10
-
11
-
12
-
13
-
14
-
15
-
16
-
17
-
18
-
19
-
20
-
21
-
22
-
23
-
 24
24 -
 25
25 -
 26
26 -
 27
27 -
 28
28 -
 29
29 -
 30
30 -
 31
31 -
 32
32 -
 33
33 -
 34
34 -
 35
35 -
 36
36 -
 37
37 -
 38
38 -
 39
39 -
 40
40 -
 41
41 -
 42
42 -
 43
43 -
 44
44 -
45
-
46
-
47
-
48
-
49
-
50
-
51
-
52
-
53
-
54
-
55
-
56
-
57
-
58
-
59
-
60
-
61
-
62
-
63
-
64
-
65
-
66
-
67
-
68
-
69
-
70
-
71
-
72
-
73
-
74
-
75
-
76
-
77
-
78
-
79
-
80
-
81
-
82
-
83
-
84
-
85
-
86
-
87
-
88
-
89
-
90
-
91
-
92
-
93
-
94
-
95
-
96
-
97
-
98
-
99
-
100
-
101
-
102
-
103
-
104
-
105
-
106
-
107
-
108
-
109
-
110
-
111
-
112
-
113
-
114
-
115
-
116
-
117
-
118
-
119
-
120
-
121
-
122
-
123
-
124
-
125
-
126
-
127
-
128
-
129
-
130
-
131
-
132
-
133
-
134
-
135
-
136
 |
 |
MANAGEMENT’S DISCUSSION AND ANALYSIS
(In millions of dollars)
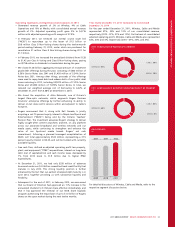
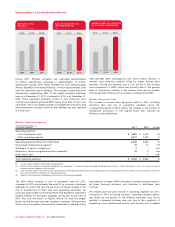
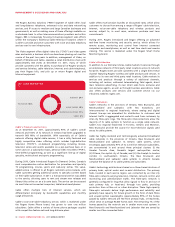
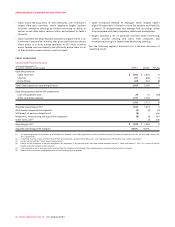
WIRELESS DATA
REVENUE
$1,366 $1,832 $2,325
2009 20102011
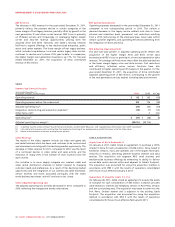
(%)
DATA REVENUE PERCENT
OF BLENDED ARPU
21.9% 28.1% 35.2%
2009 20102011
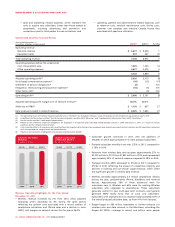
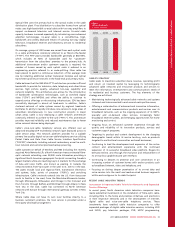
During 2011, Wireless activated and upgraded approximately
2.5 million smartphones, compared to approximately 1.9 million
smartphones during 2010. These smartphones were predominately
iPhone, BlackBerry and Android devices, of which approximately 38%
were for subscribers new to Wireless. This resulted in subscribers with
smartphones representing 56% of the overall postpaid subscriber
base as at December 31, 2011, compared to 41% as at December 31,
2010. These subscribers generally commit to new multi-year term
contracts and typically generate ARPU nearly twice that of voice only
subscribers. This is the largest number of smartphone activations and
new smartphone customer additions that Wireless has ever reported
in a fiscal year.
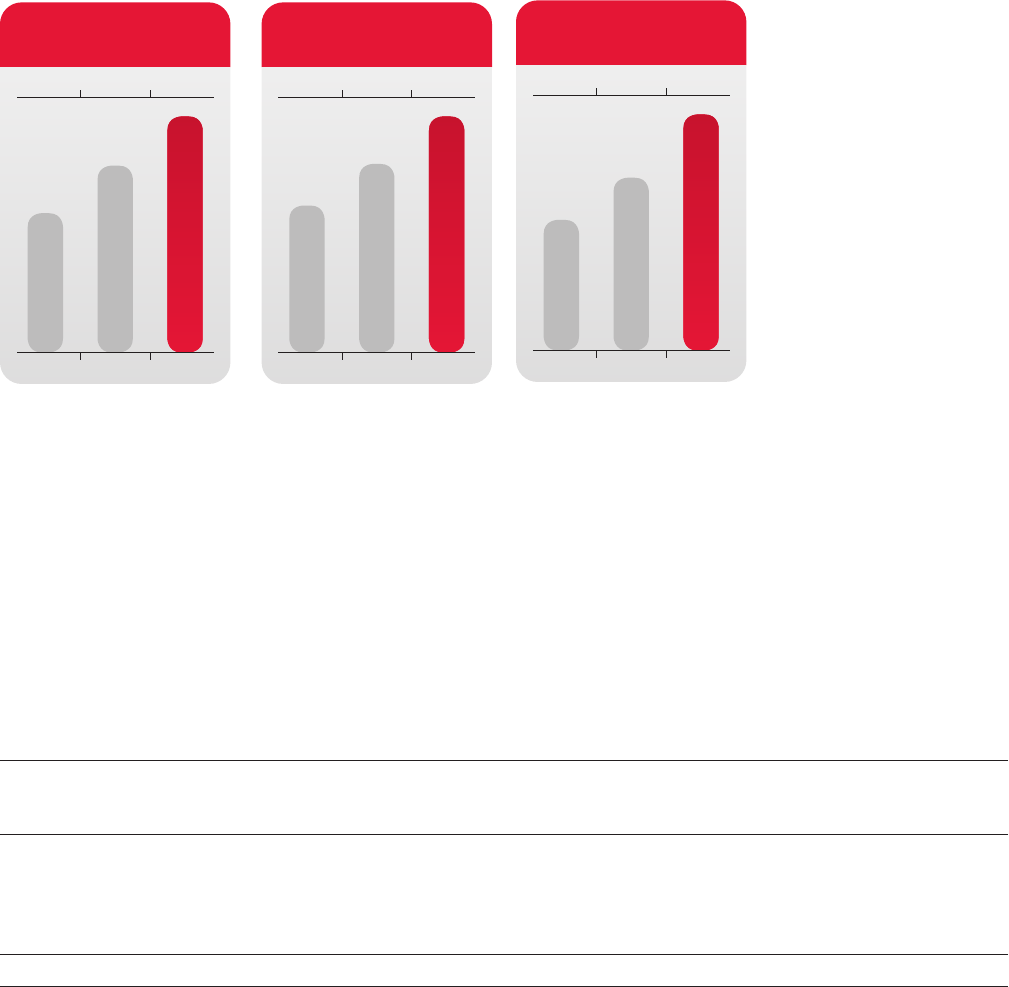
(%)
SMARTPHONES AS A PERCENT
OF POSTPAID SUBSCRIBERS
31.0% 41.0% 56.0%
2009 20102011
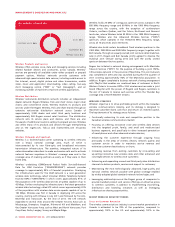
Year-over-year ARPU decreased by 4%, which reflects declines in
wireless voice revenues, partially offset by higher wireless data
revenues. Driving this decrease was a 13% decline in the wireless
voice component of ARPU, which was primarily due to the general
level of competitive intensity in the wireless voice services market,
and was partially offset by a 21% increase in wireless data ARPU.
Wireless Equipment Sales
The increase in revenue from equipment sales for 2011, including
activation fees and net of equipment subsidies, versus the
corresponding period of 2010, reflects the increase in the number of
smartphone activations to the highest levels ever reported by
Wireless, as discussed above.
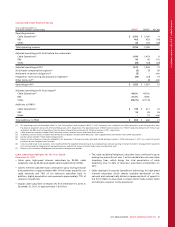
Wireless Operating Expenses
Years ended December 31,
(In millions of dollars) 2011 2010 % Chg
Operating expenses
Cost of equipment sales $ 1,425 $ 1,225 16
Other operating expenses 2,677 2,575 4
Operating expenses before the undernoted 4,102 3,800 8
Stock-based compensation expense(1) 10 12 (17)
Settlement of pension obligations(2) 2– n/m
Integration, restructuring and acquisition expenses(3) 16 5 n/m
Other items, net(4) –5 n/m
Total operating expenses $ 4,130 $ 3,822 8
(1) See the section entitled “Stock-based Compensation”.
(2) Relates to the settlement of pension obligations for employees in the pension plans who had retired between January 1, 2009 and January 1, 2011, as a result of annuity
purchases by the Company’s pension plans.
(3) Costs incurred relate to (i) severance costs resulting from the targeted restructuring of our employee base and outsourcing of certain functions and (ii) acquisition transaction
costs incurred and the integration of acquired businesses.
(4) Relates to the resolution of obligations and accruals relating to prior periods.
The $200 million increase in cost of equipment sales for 2011,
compared to 2010, was primarily the result of an increase in hardware
upgrade units versus the prior period and a continued increase in the
mix of smartphones for both new and upgrading subscribers. An
unusually large number of existing iPhone and BlackBerry subscribers
became eligible for hardware upgrades during the second half of
2011. This, and the launch of Apple’s iPhone 4S, were the largest
factors driving the year-over-year increase in expenses. Wireless views
these costs as net present value positive investments in the acquisition
and retention of higher ARPU subscribers, as these customers tend to
be lower churning customers who subscribe to multi-year term
contracts.
The modest year-over-year increase in operating expenses for 2011,
compared to 2010, excluding retention spending discussed below,
was driven by the growth in the Wireless subscriber base, which
resulted in increased customer care costs due to the complexity of
supporting more sophisticated devices and services, and increased
30 ROGERS COMMUNICATIONS INC. 2011 ANNUAL REPORT