Rogers 2011 Annual Report Download - page 77
Download and view the complete annual report
Please find page 77 of the 2011 Rogers annual report below. You can navigate through the pages in the report by either clicking on the pages listed below, or by using the keyword search tool below to find specific information within the annual report.-
 1
1 -
2
-
3
-
4
-
5
-
6
-
7
-
8
-
9
-
10
-
11
-
12
-
13
-
14
-
15
-
16
-
17
-
18
-
19
-
20
-
21
-
22
-
23
-
24
-
25
-
26
-
27
-
28
-
29
-
30
-
31
-
32
-
33
-
34
-
35
-
36
-
37
-
38
-
39
-
40
-
41
-
42
-
43
-
44
-
45
-
46
-
47
-
48
-
49
-
50
-
51
-
52
-
53
-
54
-
55
-
56
-
57
-
58
-
59
-
60
-
61
-
62
-
63
-
64
-
65
-
66
-
 67
67 -
 68
68 -
 69
69 -
 70
70 -
 71
71 -
 72
72 -
 73
73 -
 74
74 -
 75
75 -
 76
76 -
 77
77 -
 78
78 -
 79
79 -
 80
80 -
 81
81 -
 82
82 -
 83
83 -
 84
84 -
 85
85 -
 86
86 -
 87
87 -
88
-
89
-
90
-
91
-
92
-
93
-
94
-
95
-
96
-
97
-
98
-
99
-
100
-
101
-
102
-
103
-
104
-
105
-
106
-
107
-
108
-
109
-
110
-
111
-
112
-
113
-
114
-
115
-
116
-
117
-
118
-
119
-
120
-
121
-
122
-
123
-
124
-
125
-
126
-
127
-
128
-
129
-
130
-
131
-
132
-
133
-
134
-
135
-
136
 |
 |

MANAGEMENT’S DISCUSSION AND ANALYSIS
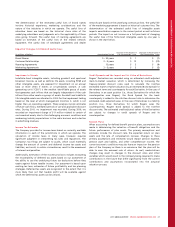
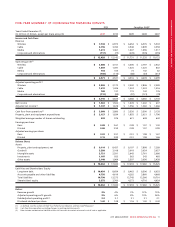
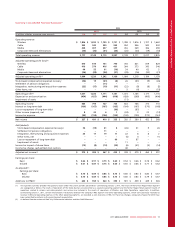
Quarterly Consolidated Financial Summary(1)
IFRS
2011 2010
(In millions of dollars, except per share amounts) Q4 Q3 Q2 Q1 Q4 Q3 Q2 Q1
Operating revenue
Wireless $1,826 $ 1,832 $ 1,759 $ 1,721 $ 1,788 $ 1,816 $ 1,707 $ 1,662
Cable 953 940 950 953 954 946 943 942
Media 428407 437 339 416 369 386 290
Corporate items and eliminations (30) (30) (31) (26) (20) (20) (19) (18)
Total operating revenue 3,177 3,149 3,115 2,9873,138 3,111 3,017 2,876
Adjusted operating profit (loss)(2)
Wireless 670 815 761 790 704 821 819 829
Cable 416 379 416 401 364 373 343 346
Media 44 55 91 (10) 24 40 62 5
Corporate items and eliminations (36) (29) (26) (21) (28) (16) (30) (21)
Adjusted operating profit(2) 1,094 1,220 1,242 1,160 1,064 1,218 1,194 1,159
Stock-based compensation (expense) recovery (34) 19 (41) (8)26 (41) (9) (26)
Settlement of pension obligations – – (11) –––––
Integration, restructuring and acquisition expenses (23) (17) (19) (11) (22) (8) (8) (2)
Other items, net ––––5 (4) –(15)
Operating profit(2) 1,037 1,222 1,171 1,141 1,073 1,165 1,177 1,116
Depreciation and amortization (454) (427) (444) (418)(429) (399) (405) (406)
Impairment of assets ––––(11) –––
Operating income 583 795 727 723 633 766 772 710
Interest on long-term debt (169) (167) (167) (165) (164) (167) (170) (168)
Loss on repayment of long-term debt – – – (99) – (87) ––
Other income (expense), net 822 6 1 (24) 3 23 (13)
Income tax expense (95) (159) (156) (125) (143) (135) (173) (161)
Net income $ 327 $ 491 $ 410 $ 335 $ 302 $ 380 $ 452 $ 368
Add (deduct):
Stock-based compensation expense (recovery) 34 (19) 41 8(26) 41 9 26
Settlement of pension obligations ––11–––––
Integration, restructuring and acquisition expenses 23 17 19 11 22882
Other items, net ––––(5) 4 –15
Loss on repayment of long-term debt –––99–87 ––
Impairment of assets ––––11 –––
Income tax impact of above items (12) (4) (14) (30) (6) (41) (5) (14)
Income tax charge, cash-settled stock options ––––40 –––
Adjusted net income(2) $ 372 $ 485 $ 467 $ 423 $ 338 $ 479 $ 464 $ 397
Earnings per share:
Basic $ 0.62 $ 0.91 $ 0.75 $ 0.60 $ 0.54 $ 0.66 $ 0.78 $ 0.62
Diluted $ 0.61 $ 0.87 $ 0.75 $ 0.60 $ 0.50 $ 0.66 $ 0.77 $ 0.62
As adjusted(2):
Earnings per share:
Basic $ 0.70 $ 0.89$ 0.85 $ 0.76 $ 0.60 $ 0.83 $ 0.80 $ 0.67
Diluted $ 0.70 $ 0.89$ 0.85 $ 0.76 $ 0.60 $ 0.83 $ 0.79 $ 0.67
Additions to PP&E(2) $ 653 $ 559 $ 520 $ 395 $ 591 $ 439 $ 439 $ 365
(1) This quarterly summary provides the quarterly results under the current period’s presentation. Commencing January 1, 2011, the results of the former Rogers Retail segment
are segregated as follows: the results of operations of the Video business are presented as a separate operating segment and the former Rogers Retail segment results of
operations related to wireless and cable products and services are included in the results of operations of Wireless and Cable Operations, respectively. In addition,
commencing January 1, 2011, certain intercompany transactions between the Company’s RBS segment and other operating segments, which were previously recorded as
revenue in RBS and operating expenses in the other operating segments, are recorded as cost recoveries in RBS. For these two changes, comparative figures for 2010 have
been reclassified to conform to the current period’s presentation.
(2) As defined. See the section entitled “Key Performance Indicators and Non-GAAP Measures”.
2011 ANNUAL REPORT ROGERS COMMUNICATIONS INC. 73