Rogers 2011 Annual Report Download - page 55
Download and view the complete annual report
Please find page 55 of the 2011 Rogers annual report below. You can navigate through the pages in the report by either clicking on the pages listed below, or by using the keyword search tool below to find specific information within the annual report.-
 1
1 -
2
-
3
-
4
-
5
-
6
-
7
-
8
-
9
-
10
-
11
-
12
-
13
-
14
-
15
-
16
-
17
-
18
-
19
-
20
-
21
-
22
-
23
-
24
-
25
-
26
-
27
-
28
-
29
-
30
-
31
-
32
-
33
-
34
-
35
-
36
-
37
-
38
-
39
-
40
-
41
-
42
-
43
-
44
-
 45
45 -
 46
46 -
 47
47 -
 48
48 -
 49
49 -
 50
50 -
 51
51 -
 52
52 -
 53
53 -
 54
54 -
 55
55 -
 56
56 -
 57
57 -
 58
58 -
 59
59 -
 60
60 -
 61
61 -
 62
62 -
 63
63 -
 64
64 -
 65
65 -
66
-
67
-
68
-
69
-
70
-
71
-
72
-
73
-
74
-
75
-
76
-
77
-
78
-
79
-
80
-
81
-
82
-
83
-
84
-
85
-
86
-
87
-
88
-
89
-
90
-
91
-
92
-
93
-
94
-
95
-
96
-
97
-
98
-
99
-
100
-
101
-
102
-
103
-
104
-
105
-
106
-
107
-
108
-
109
-
110
-
111
-
112
-
113
-
114
-
115
-
116
-
117
-
118
-
119
-
120
-
121
-
122
-
123
-
124
-
125
-
126
-
127
-
128
-
129
-
130
-
131
-
132
-
133
-
134
-
135
-
136
 |
 |

MANAGEMENT’S DISCUSSION AND ANALYSIS
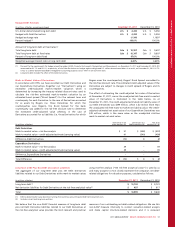
Hedged Debt Position
(In millions of dollars, except percentages) December 31, 2011 December 31, 2010
U.S. dollar-denominated long-term debt U.S. $ 4,230 U.S. $ 5,050
Hedged with Debt Derivatives U.S. $ 4,230 U.S. $ 5,050
Hedged exchange rate 1.1340 1.1697
Percent hedged(1) 100.0%100.0%
Amount of long-term debt at fixed rates:(2)
Total long-term debt Cdn $ 10,597 Cdn $ 9,607
Total long-term debt at fixed rates Cdn $ 10,347 Cdn $ 9,607
Percent of long-term debt fixed 97.6%100.0%
Weighted average interest rate on long-term debt 6.22%6.68%
(1) Pursuant to the requirements for hedge accounting under IAS 39, Financial Instruments: Recognition and Measurement, on December 31, 2011 and December 31, 2010, RCI
accounted for 91.7% and 93.1%, respectively, of our Debt Derivatives as hedges against designated U.S. dollar-denominated debt. As a result, on December 31, 2011 91.7%
of our U.S. dollar-denominated debt is hedged for accounting purposes versus 100% on an economic basis.
(2) Long-term debt includes the effect of the Debt Derivatives.
Mark-to-Market Value of Derivatives
In accordance with IFRS, we have recorded our Debt Derivatives and
our Expenditure Derivatives (together our “Derivatives”) using an
estimated credit-adjusted mark-to-market valuation which is
determined by increasing the treasury related discount rates used to
calculate the risk-free estimated mark-to-market valuation by an
estimated bond spread (“Bond Spread”) for the relevant term and
counterparty for each Derivative. In the case of Derivatives accounted
for as assets by Rogers (i.e. those Derivatives for which the
counterparties owe Rogers), the Bond Spread for the bank
counterparty was added to the risk-free discount rate to determine
the estimated credit-adjusted value whereas, in the case of
Derivatives accounted for as liabilities (i.e. those Derivatives for which
Rogers owes the counterparties), Rogers’ Bond Spread was added to
the risk-free discount rate. The estimated credit-adjusted values of the
Derivatives are subject to changes in credit spreads of Rogers and its
counterparties.
The effect of estimating the credit-adjusted fair value of Derivatives
at December 31, 2011, versus the unadjusted risk-free mark-to-market
value of Derivatives is illustrated in the table below. As at
December 31, 2011, the credit-adjusted estimated net liability value of
our Debt Derivatives was $499 million, which is $2 million more than
the unadjusted risk-free mark-to-market net liability value. The credit-
adjusted estimated net asset value of our Expenditure Derivatives was
$39 million, which is the same value as the unadjusted risk-free
mark-to-market net asset value.
(In millions of dollars) Derivatives in an
asset position (A) Derivatives in a
liability position (B) Net asset
position (A + B)
Debt Derivatives
Mark-to-market value – risk-free analysis $ 51 $ (548) $ (497)
Mark-to-market value – credit-adjusted estimate (carrying value) 41 (540) (499)
Difference, Debt Derivatives (10) 8 (2)
Expenditure Derivatives
Mark-to-market value – risk-free analysis 39 – 39
Mark-to-market value – credit-adjusted estimate (carrying value) 39 – 39
Difference, Expenditure Derivatives –––
Total Difference $ (10) $ 8 $ (2)
Long-term Debt Plus Net Debt Derivative Liabilities
The aggregate of our long-term debt plus net Debt Derivatives
liabilities related to our Debt Derivatives at the mark-to-market values
using risk-free analysis (“the risk-free analytical value”) is used by us
and many analysts to most closely represent the Company’s net debt-
related obligations for valuation purposes, calculated as follows:
(In millions of dollars) December 31, 2011 December 31, 2010
Long-term debt(1) $ 10,102 $ 8,723
Net derivative liabilities for Debt Derivatives at the risk-free analytical value(2) $ 497 $ 917
Total $ 10,599 $ 9,640
(1) Before deducting fair value decrement arising from purchase accounting and deferred transaction costs.
(2) Includes current and long-term portions.
We believe that the non-GAAP financial measure of long-term debt
plus net Debt Derivative liabilities related to our Debt Derivatives at
the risk-free analytical value provides the most relevant and practical
measure of our outstanding net debt-related obligations. We use this
non-GAAP measure internally to conduct valuation-related analysis
and make capital structure-related decisions and it is reviewed
2011 ANNUAL REPORT ROGERS COMMUNICATIONS INC. 51