Rogers 2011 Annual Report Download - page 50
Download and view the complete annual report
Please find page 50 of the 2011 Rogers annual report below. You can navigate through the pages in the report by either clicking on the pages listed below, or by using the keyword search tool below to find specific information within the annual report.-
 1
1 -
2
-
3
-
4
-
5
-
6
-
7
-
8
-
9
-
10
-
11
-
12
-
13
-
14
-
15
-
16
-
17
-
18
-
19
-
20
-
21
-
22
-
23
-
24
-
25
-
26
-
27
-
28
-
29
-
30
-
31
-
32
-
33
-
34
-
35
-
36
-
37
-
38
-
39
-
 40
40 -
 41
41 -
 42
42 -
 43
43 -
 44
44 -
 45
45 -
 46
46 -
 47
47 -
 48
48 -
 49
49 -
 50
50 -
 51
51 -
 52
52 -
 53
53 -
 54
54 -
 55
55 -
 56
56 -
 57
57 -
 58
58 -
 59
59 -
 60
60 -
61
-
62
-
63
-
64
-
65
-
66
-
67
-
68
-
69
-
70
-
71
-
72
-
73
-
74
-
75
-
76
-
77
-
78
-
79
-
80
-
81
-
82
-
83
-
84
-
85
-
86
-
87
-
88
-
89
-
90
-
91
-
92
-
93
-
94
-
95
-
96
-
97
-
98
-
99
-
100
-
101
-
102
-
103
-
104
-
105
-
106
-
107
-
108
-
109
-
110
-
111
-
112
-
113
-
114
-
115
-
116
-
117
-
118
-
119
-
120
-
121
-
122
-
123
-
124
-
125
-
126
-
127
-
128
-
129
-
130
-
131
-
132
-
133
-
134
-
135
-
136
 |
 |

MANAGEMENT’S DISCUSSION AND ANALYSIS
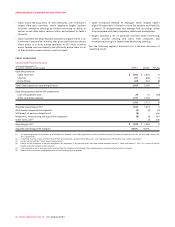
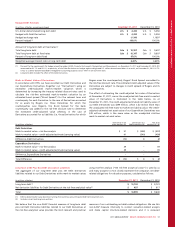
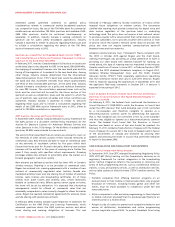
Income tax expense varies from the amounts that would be computed
by applying the statutory income tax rate to income before income
taxes for the following reasons:
Years ended December 31,
(In millions of dollars) 2011 2010
Statutory income tax rate 28.0%30.5%
Income before income taxes $ 2,098$ 2,114
Computed income tax expense $587$ 645
Increase (decrease) in income taxes resulting from:
Effect of tax rate changes (59) (69)
Recognition of previously unrecognized deferred tax assets (12) (5)
Stock-based compensation 440
Other items 15 1
Income tax expense $ 535 $ 612
Effective income tax rate 25.5%28.9%
Other Income
Other income of $8 million in 2011 was primarily associated with
investment income and expenses from certain of our investments,
compared to income of $1 million in 2010.
Interest on Long-Term Debt
The $1 million decrease in interest expense during 2011, compared to
2010, reflects the decrease in the weighted-average interest rate on
long-term debt at December 31, 2011 compared to December 31,
2010, substantially offset by an increase in the principal amount of
long-term debt through December 31, 2011, compared to
December 31, 2010, including the impact of cross-currency interest
exchange agreements (“Debt Derivatives”). The change in principal
and weighted-average interest rate primarily reflects the re-financing
activities completed in the first quarter of 2011. See the section
entitled “Liquidity and Capital Resources”.
Loss on Repayment of Long-Term Debt
During 2011, we recorded a loss of repayment of long-term debt of
$99 million, comprised of aggregate redemption premiums of $76
million related to the redemption of two public debt issues, a net loss
on the termination of the related Debt Derivatives of $22 million, and
a write-off of deferred transaction costs of $2 million, partially offset
by a gain of $1 million relating to the non-cash write-down of the fair
value increment of long-term debt. (See the section entitled “Debt
Redemptions and Termination of Derivatives”).
Foreign Exchange Loss (Gain)
During 2011, the Canadian dollar weakened by 2.2 cents versus the
U.S. dollar resulting in a foreign exchange loss of $6 million, primarily
related to our US$350 million of Senior Notes due 2038 for which the
associated Debt Derivatives have not been designated as hedges for
accounting purposes. Much of this foreign exchange loss is offset by
the coincident change in the fair value of our Derivative instruments
as discussed below. During 2010, the Canadian dollar strengthened by
5.6 cents versus the U.S. dollar, resulting in a foreign exchange gain
of $20 million, primarily related to our US$350 million of Senior Notes
due 2038 for which the associated Debt Derivatives have not been
designated as hedges for accounting purposes.
Change in Fair Value of Derivative Instruments
In 2011, the change in fair value of the derivative instruments was the
result of the $14 million (2010 – $22 million) non-cash change in the
fair value of the Debt Derivatives hedging our US$350 million Senior
Notes due 2038 that have not been designated as hedges for
accounting purposes. This change in fair value of the Debt Derivatives
was primarily caused by the Canadian dollar’s weakening by 2.2 cents
in 2011 (2010 – strengthening by 5.6 cents) versus the U.S. dollar. We
have measured the fair value of our Debt Derivatives using an
estimated credit-adjusted mark-to-market valuation. Much of this
change in the fair value of our derivative instruments is offset by the
foreign exchange loss discussed above. For the impact, refer to the
section entitled “Mark-to-Market Value of Derivatives”.
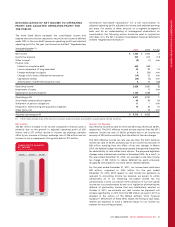
Operating Income
The decrease in our operating income compared to the prior year is
due to the increase in operating expenses of $205 million, an increase
in depreciation and amortization of $104 million, as well as an
increase in stock-based compensation expense, settlement of pension
obligations, integration, restructuring and acquisition expenses and
other items of $41 million, partially offset by an increase in revenue
of $286 million and a decrease in impairment of assets of $11 million.
See the detailed discussion on respective segment results included in
this section entitled “Segment Review” above.
Impairment of Assets
There was no impairment of assets charge for 2011. During 2010, we
determined that the fair values of certain of Media’s radio stations
were lower than their carrying value and we recorded a non-cash
impairment charge of $11 million, primarily resulting from the
weakening of advertising revenues in local markets.
Depreciation and Amortization Expense
The year-over-year increase in depreciation and amortization expense
was due to certain IT and network assets brought to use in 2011,
compared to 2010, and an increase in amortization of intangible
assets resulting from acquisitions over the past year.
Stock-based Compensation
Our employee stock option plans attach cash-settled share
appreciation rights (“SARs”) to all new and previously granted
options. The SAR feature allows the option holder to elect to receive
in cash an amount equal to the intrinsic value, instead of exercising
the option and acquiring Class B Non-Voting shares. All outstanding
stock options are classified as liabilities and are carried at their fair
value, as adjusted for vesting, measured as using option pricing
models. The liability is marked-to-market each period and is
amortized to expense using a graded vesting approach over the
period in which the related services are rendered or, as applicable,
over the period to the date an employee is eligible to retire,
whichever is shorter.
46 ROGERS COMMUNICATIONS INC. 2011 ANNUAL REPORT