Rogers 2011 Annual Report Download - page 125
Download and view the complete annual report
Please find page 125 of the 2011 Rogers annual report below. You can navigate through the pages in the report by either clicking on the pages listed below, or by using the keyword search tool below to find specific information within the annual report.-
 1
1 -
2
-
3
-
4
-
5
-
6
-
7
-
8
-
9
-
10
-
11
-
12
-
13
-
14
-
15
-
16
-
17
-
18
-
19
-
20
-
21
-
22
-
23
-
24
-
25
-
26
-
27
-
28
-
29
-
30
-
31
-
32
-
33
-
34
-
35
-
36
-
37
-
38
-
39
-
40
-
41
-
42
-
43
-
44
-
45
-
46
-
47
-
48
-
49
-
50
-
51
-
52
-
53
-
54
-
55
-
56
-
57
-
58
-
59
-
60
-
61
-
62
-
63
-
64
-
65
-
66
-
67
-
68
-
69
-
70
-
71
-
72
-
73
-
74
-
75
-
76
-
77
-
78
-
79
-
80
-
81
-
82
-
83
-
84
-
85
-
86
-
87
-
88
-
89
-
90
-
91
-
92
-
93
-
94
-
95
-
96
-
97
-
98
-
99
-
100
-
101
-
102
-
103
-
104
-
105
-
106
-
107
-
108
-
109
-
110
-
111
-
112
-
113
-
114
-
 115
115 -
 116
116 -
 117
117 -
 118
118 -
 119
119 -
 120
120 -
 121
121 -
 122
122 -
 123
123 -
 124
124 -
 125
125 -
 126
126 -
 127
127 -
 128
128 -
 129
129 -
 130
130 -
 131
131 -
 132
132 -
 133
133 -
 134
134 -
 135
135 -
136
 |
 |

NOTES TO CONSOLIDATED FINANCIAL STATEMENTS
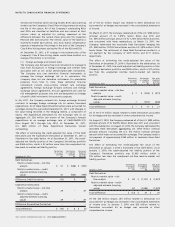
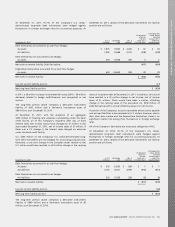
A summary of stock-based compensation expense, which is included
in employee salaries and benefits expense, is as follows:
Years ended December 31, 2011 2010
Stock-based compensation:
Stock options (a) $29 $28
Restricted share units (b) 26 19
Deferred share units (c) 93
$64 $50
Total fair value amount of stock-based compensation liabilities is as
follows:
December 31,
2011 December 31,
2010 January 1,
2010
Stock-based compensation:
Stock options (a) $ 124 $ 133 $ 160
Restricted share units (b) 40 28 17
Deferred share units (c) 30 19 17
$ 194 $ 180 $ 194
At December 31, 2011, the Company had a liability of $194 million
(December 31, 2010 – $180 million; January 1, 2010 – $194 million), of
which $161 million (December 31, 2010 – $157 million; January 1,
2010 – $174 million) is a current liability related to stock-based
compensation recorded at its fair value, including stock options, RSUs
and DSUs. The total intrinsic value of vested liabilities, which is the
difference between the strike price of the share-based awards and
the trading price of the RCI Class B Non-Voting shares for all vested
share-based awards at December 31, 2011 was $124 million
(December 31, 2010 – $122 million; January 1, 2010 – $149 million).
During the year ended December 31, 2011, $45 million (2010 - $58
million) was paid to holders upon exercise of RSUs and stock options
using the cash settlement feature at an average share price of RCI
Class B Non-Voting share of $36.42.
(a) Stock options:
(i) Stock option plans:
Options to purchase Class B Non-Voting shares of the Company
on a one-for-one basis may be granted to employees, directors
and officers of the Company and its affiliates by the Board of
Directors or by the Company’s Management Compensation
Committee. There are 30 million options authorized under the
2000 Plan, 25 million options authorized under the 1996 Plan,
and 9.5 million options authorized under the 1994 Plan. The
term of each option is 7 to 10 years and the vesting period is
generally graded vesting over four years but may be adjusted by
the Management Compensation Committee on the date of
grant. The exercise price for options is equal to the fair market
value of the Class B Non-Voting shares determined as the
five-day average before the grant date as quoted on the TSX.
Stock options are measured at fair value at each period end,
determined using the Company’s Class B Non-Voting share price
and the Black-Scholes model.
(ii) Performance options:
During the year ended December 31, 2011, the Company
granted 581,300 performance-based options (2010 – 759,200) to
certain key executives. These options are governed by the terms
of the 2000 Plan. These options vest on a straight-line basis over
four years provided that certain targeted stock prices are met on
or after the anniversary date. At December 31, 2011, 5,056,430
performance options (December 31, 2010 – 4,894,980; January 1,
2010 – 4,479,930) were outstanding.
Performance options are measured at fair value at each period
end, determined using the Company’s Class B Non-Voting share
price and the trinomial model.
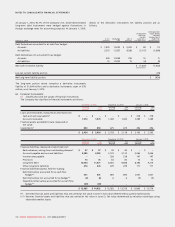
(iii) Summary of stock options:
A summary of the stock option plans, which includes performance options, is as follows:
December 31, 2011 December 31, 2010
Number of
options
Weighted
average
exercise price Number of
options
Weighted
average
exercise price
Outstanding, beginning of year 11,841,680 $ 26.42 13,467,096 $ 23.73
Granted 1,133,600 34.35 1,350,225 34.69
Exercised (1,778,783) 15.96 (2,528,585) 14.78
Forfeited (507,398) 35.20 (447,056) 34.89
Outstanding, end of year 10,689,099 $ 28.59 11,841,680 $ 26.42
Exercisable, end of year 5,716,945 $ 22.816,415,933 $ 19.24
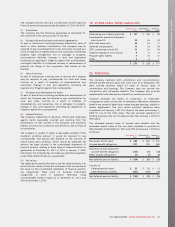
At December 31, 2011, the range of exercise prices, the weighted average exercise price and the weighted average remaining contractual life
are as follows:
Options outstanding Options exercisable
Range of exercise prices Number
outstanding
Weighted average
remaining contractual
life (years) Weighted average
exercise price Number
exercisable Weighted average
exercise price
$ 4.83 – $ 9.99 417,557 1.46 $ 7.61 417,557 $ 7.61
$ 10.00 – $ 11.99 1,502,107 1.60 10.44 1,502,107 10.44
$ 12.00 – $ 18.99 510,908 1.48 14.10 510,908 14.10
$ 19.00 – $ 24.99 905,708 1.15 22.64 905,708 22.64
$ 25.00 – $ 29.99 1,648,175 4.08 29.41 703,750 29.41
$ 30.00 – $ 37.99 2,458,332 5.45 34.10 408,863 33.49
$ 38.00 – $ 46.94 3,246,312 2.63 39.03 1,268,052 39.00
10,689,099 3.13 $ 28.59 5,716,945 $ 22.81
2011 ANNUAL REPORT ROGERS COMMUNICATIONS INC. 121