Rogers 2011 Annual Report Download - page 29
Download and view the complete annual report
Please find page 29 of the 2011 Rogers annual report below. You can navigate through the pages in the report by either clicking on the pages listed below, or by using the keyword search tool below to find specific information within the annual report.-
 1
1 -
2
-
3
-
4
-
5
-
6
-
7
-
8
-
9
-
10
-
11
-
12
-
13
-
14
-
15
-
16
-
17
-
18
-
 19
19 -
 20
20 -
 21
21 -
 22
22 -
 23
23 -
 24
24 -
 25
25 -
 26
26 -
 27
27 -
 28
28 -
 29
29 -
 30
30 -
 31
31 -
 32
32 -
 33
33 -
 34
34 -
 35
35 -
 36
36 -
 37
37 -
 38
38 -
 39
39 -
40
-
41
-
42
-
43
-
44
-
45
-
46
-
47
-
48
-
49
-
50
-
51
-
52
-
53
-
54
-
55
-
56
-
57
-
58
-
59
-
60
-
61
-
62
-
63
-
64
-
65
-
66
-
67
-
68
-
69
-
70
-
71
-
72
-
73
-
74
-
75
-
76
-
77
-
78
-
79
-
80
-
81
-
82
-
83
-
84
-
85
-
86
-
87
-
88
-
89
-
90
-
91
-
92
-
93
-
94
-
95
-
96
-
97
-
98
-
99
-
100
-
101
-
102
-
103
-
104
-
105
-
106
-
107
-
108
-
109
-
110
-
111
-
112
-
113
-
114
-
115
-
116
-
117
-
118
-
119
-
120
-
121
-
122
-
123
-
124
-
125
-
126
-
127
-
128
-
129
-
130
-
131
-
132
-
133
-
134
-
135
-
136
 |
 |

MANAGEMENT’S DISCUSSION AND ANALYSIS
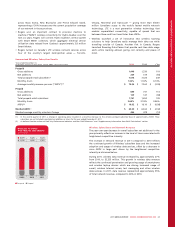
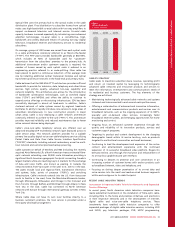
Of the $286 million year-over-year increase in our consolidated
revenue, Wireless contributed $165 million, Cable Operations
contributed $119 million and Media contributed $150 million,
partially offset by decreases in revenue of $47 million in RBS and
$61 million in Video, and an increase in corporate items and
eliminations of $40 million.
Of the $81 million year-over-year increase in our consolidated
adjusted operating profit, Cable Operations contributed $130 million,
RBS contributed $46 million, Video contributed $10 million and Media
contributed $49 million, partially offset by a decrease in Wireless of
$137 million and an increase in corporate items and eliminations of
$17 million.
Refer to the respective individual segment discussions for details of
the revenue, operating expenses, operating profit and additions to
PP&E of Wireless, Cable and Media.
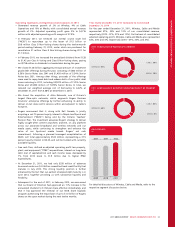
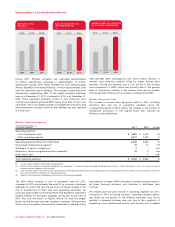
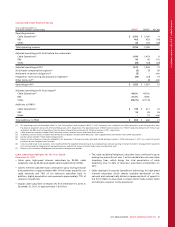
2011 Performance Against Targets
The following table sets forth the guidance ranges for selected
full-year financial and operating metrics that we provided for 2011
versus the actual results we achieved for the year. We achieved
performance consistent with our adjusted operating profit and
after-tax free cash flow financial objectives that were set forth for
2011, and additions to PP&E exceeded the high end of our guidance
range by $77 million, which was primarily related to the accelerated
deployment of our LTE 4G wireless network.
(In millions of dollars)
IFRS
2010
Actual
2011 Guidance
Range $ (As at
February 16, 2011) 2011
Actual
Consolidated Guidance
Adjusted operating profit(1) $ 4,635 $ 4,600 to $ 4,765 $ 4,716
Additions to PP&E(2) 1,834 1,950 to 2,050 2,127
After-tax free cash flow(3) 1,983 1,850 to 1,975 1,851
(1) Excludes (i) stock-based compensation expense; (ii) integration, restructuring and
acquisition expenses; (iii) settlement of pension obligations; and (iv) other items,
net.
(2) Includes additions to Wireless, Cable Operations, Media, RBS, Video and
Corporate PP&E expenditures.
(3) After-tax free cash flow is defined as adjusted operating profit less PP&E
expenditures, interest on long-term debt (net of capitalization) and cash income
taxes, and is not a defined term under IFRS.
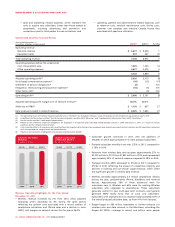
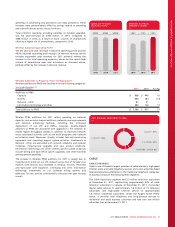
2012 FINANCIAL GUIDANCE
The following table outlines guidance ranges and assumptions for
selected 2012 financial metrics. This information is forward-looking
and should be read in conjunction with the section entitled “Caution
Regarding Forward-Looking Statements, Risks and Assumptions” and
the related disclosures, for the various economic, competitive, and
regulatory assumptions and factors that could cause actual future
financial and operating results to differ from those currently
expected.
Full Year 2012 Guidance
(In millions of dollars) 2011
Actual 2012
Guidance
Consolidated Guidance
Adjusted operating profit(1) $ 4,716 $ 4,730 to $ 4,915
Additions to PP&E(2) 2,127 2,075 to 2,175
Pre-tax free cash flow(3) 1,950 1,950 to 2,050
Cash income taxes 99 425 to 475
(1) Excludes (i) stock-based compensation expense (recovery); (ii) integration,
restructuring and acquisition expenses; (iii) settlement of pension obligations;
and (iv) other items, net.
(2) Includes additions to Wireless, Cable Operations, Media, RBS, Video and
Corporate PP&E expenditures.
(3) Pre-tax free cash flow is defined as adjusted operating profit less PP&E
expenditures and interest on long-term debt (net of capitalization), and is not a
defined term under IFRS.
2. SEGMENT REVIEW
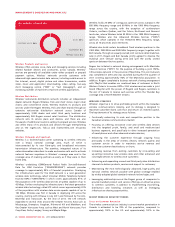
WIRELESS
WIRELESS BUSINESS
Wireless is the largest Canadian wireless communications service
provider, serving approximately 9.3 million retail voice and data
subscribers at December 31, 2011, representing approximately 35% of
Canadian wireless subscribers. Wireless operates on the global
standard Global System for Mobile communications/High-Speed
Packet Access/Long Term Evolution (“GSM/HSPA/LTE”) wireless
network technology platforms.
Wireless customers are able to access their services in most parts of
the world through roaming agreements with various other GSM and
HSPA wireless network operators. Rogers has one of the largest
roaming footprints and number of available destinations for its
customers’ wireless usage in the world. With each roaming
agreement, Rogers has established a direct relationship with the
operator rather than implementing third party services. Wireless has
generally negotiated wireless roaming with multiple operators within
the majority of its roaming destinations in order to eliminate the
possibility of its customers travelling in an area without coverage. This
coverage depth also helps to ensure that Wireless’ customers roam on
the best possible network available in a specific destination.
2011 ANNUAL REPORT ROGERS COMMUNICATIONS INC. 25