Rogers 2011 Annual Report Download - page 28
Download and view the complete annual report
Please find page 28 of the 2011 Rogers annual report below. You can navigate through the pages in the report by either clicking on the pages listed below, or by using the keyword search tool below to find specific information within the annual report.-
 1
1 -
2
-
3
-
4
-
5
-
6
-
7
-
8
-
9
-
10
-
11
-
12
-
13
-
14
-
15
-
16
-
17
-
 18
18 -
 19
19 -
 20
20 -
 21
21 -
 22
22 -
 23
23 -
 24
24 -
 25
25 -
 26
26 -
 27
27 -
 28
28 -
 29
29 -
 30
30 -
 31
31 -
 32
32 -
 33
33 -
 34
34 -
 35
35 -
 36
36 -
 37
37 -
 38
38 -
39
-
40
-
41
-
42
-
43
-
44
-
45
-
46
-
47
-
48
-
49
-
50
-
51
-
52
-
53
-
54
-
55
-
56
-
57
-
58
-
59
-
60
-
61
-
62
-
63
-
64
-
65
-
66
-
67
-
68
-
69
-
70
-
71
-
72
-
73
-
74
-
75
-
76
-
77
-
78
-
79
-
80
-
81
-
82
-
83
-
84
-
85
-
86
-
87
-
88
-
89
-
90
-
91
-
92
-
93
-
94
-
95
-
96
-
97
-
98
-
99
-
100
-
101
-
102
-
103
-
104
-
105
-
106
-
107
-
108
-
109
-
110
-
111
-
112
-
113
-
114
-
115
-
116
-
117
-
118
-
119
-
120
-
121
-
122
-
123
-
124
-
125
-
126
-
127
-
128
-
129
-
130
-
131
-
132
-
133
-
134
-
135
-
136
 |
 |

MANAGEMENT’S DISCUSSION AND ANALYSIS
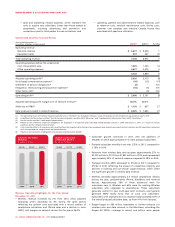
Summarized Consolidated Financial Results
Years ended December 31,
(In millions of dollars, except per share amounts) 2011 2010 % Chg
Operating revenue
Wireless $ 7,138$ 6,973 2
Cable
Cable Operations 3,309 3,190 4
RBS 405 452 (10)
Video 82143 (43)
3,796 3,785 –
Media 1,611 1,461 10
Corporate items and eliminations (117) (77) 52
Total operating revenue 12,42812,142 2
Adjusted operating profit (loss)(1)
Wireless 3,036 3,173 (4)
Cable
Cable Operations 1,549 1,419 9
RBS 8640 115
Video (23) (33) (30)
1,612 1,426 13
Media 180131 37
Corporate items and eliminations (112) (95) 18
Adjusted operating profit(1) 4,716 4,635 2
Stock-based compensation expense(3) (64) (50) 28
Settlement of pension obligations(4) (11) – n/m
Integration, restructuring and acquisition expenses(5) (70) (40) 75
Other items, net(6) –(14) n/m
Operating profit(1) 4,571 4,531 1
Other income and expense, net(7) 3,0083,029 (1)
Net income $ 1,563 $ 1,502 4
Basic earnings per share $2.88 $ 2.61 10
Diluted earnings per share $2.86$ 2.59 10
As adjusted:(2)
Net income $ 1,747 $ 1,678 4
Basic earnings per share $ 3.22 $ 2.91 11
Diluted earnings per share $ 3.19 $ 2.89 10
Additions to property, plant and equipment (“PP&E”)(1)
Wireless $ 1,192 $ 937 27
Cable
Cable Operations 748611 22
RBS 55 38 45
Video –13 n/m
803 662 21
Media 61 38 61
Corporate(8) 71 197 (64)
Total additions to PP&E $ 2,127 $ 1,834 16
(1) As defined. See the sections entitled “Key Performance Indicators and Non-GAAP Measures” and “Supplementary Information: Non-GAAP Calculations”. Operating profit should
not be considered as a substitute or alternative for operating income or net income, in each case determined in accordance with IFRS. See the section entitled “Reconciliation of
Net Income to Operating Profit and Adjusted Operating Profit for the Period” for a reconciliation of operating profit and adjusted operating profit to operating income and net
income under IFRS and the section entitled “Key Performance Indicators and Non-GAAP Measures”.
(2) For details on the determination of the ‘as adjusted’ amounts, which are non-GAAP measures, see the sections entitled “Key Performance Indicators and Non-GAAP Measures” and
“Supplementary Information: Non-GAAP Calculations”. The ‘as adjusted’ amounts presented above are reviewed regularly by management and our Board of Directors in assessing
our performance and in making decisions regarding the ongoing operations of the business and the ability to generate cash flows. The ‘as adjusted’ amounts exclude (i) stock-
based compensation expense; (ii) integration, restructuring and acquisition expenses; (iii) settlement of pension obligations; (iv) other items, net; and (v) in respect of net income
and earnings per share, loss on repayment of long-term debt, impairment of assets and the related income tax impact of the above amounts.
(3) See the section entitled “Stock-based Compensation”.
(4) Relates to the settlement of pension obligations for employees in the pension plans who had retired between January 1, 2009 and January 1, 2011, as a result of annuity purchases
by the Company’s pension plans.
(5) Costs incurred relate to (i) severance costs resulting from the targeted restructuring of our employee base and outsourcing of certain functions; (ii) acquisition transaction costs
incurred and the integration of acquired businesses; and (iii) the closure of certain Video stores and other exit costs.
(6) Relates to the resolution of obligations and accruals relating to prior periods.
(7) See the section entitled “Reconciliation of Net Income to Operating Profit and Adjusted Operating Profit for the Period”.
(8) See the section entitled “Additions to PP&E”
n/m: not meaningful.
24 ROGERS COMMUNICATIONS INC. 2011 ANNUAL REPORT