Rogers 2011 Annual Report Download - page 51
Download and view the complete annual report
Please find page 51 of the 2011 Rogers annual report below. You can navigate through the pages in the report by either clicking on the pages listed below, or by using the keyword search tool below to find specific information within the annual report.-
 1
1 -
2
-
3
-
4
-
5
-
6
-
7
-
8
-
9
-
10
-
11
-
12
-
13
-
14
-
15
-
16
-
17
-
18
-
19
-
20
-
21
-
22
-
23
-
24
-
25
-
26
-
27
-
28
-
29
-
30
-
31
-
32
-
33
-
34
-
35
-
36
-
37
-
38
-
39
-
40
-
 41
41 -
 42
42 -
 43
43 -
 44
44 -
 45
45 -
 46
46 -
 47
47 -
 48
48 -
 49
49 -
 50
50 -
 51
51 -
 52
52 -
 53
53 -
 54
54 -
 55
55 -
 56
56 -
 57
57 -
 58
58 -
 59
59 -
 60
60 -
 61
61 -
62
-
63
-
64
-
65
-
66
-
67
-
68
-
69
-
70
-
71
-
72
-
73
-
74
-
75
-
76
-
77
-
78
-
79
-
80
-
81
-
82
-
83
-
84
-
85
-
86
-
87
-
88
-
89
-
90
-
91
-
92
-
93
-
94
-
95
-
96
-
97
-
98
-
99
-
100
-
101
-
102
-
103
-
104
-
105
-
106
-
107
-
108
-
109
-
110
-
111
-
112
-
113
-
114
-
115
-
116
-
117
-
118
-
119
-
120
-
121
-
122
-
123
-
124
-
125
-
126
-
127
-
128
-
129
-
130
-
131
-
132
-
133
-
134
-
135
-
136
 |
 |

MANAGEMENT’S DISCUSSION AND ANALYSIS
The liability for stock-based compensation expense is recorded based
on the fair value of the options, as described above. The expense each
period is impacted by the change in the price of RCI’s Class B
Non-Voting shares during the life of the option. At December 31,
2011, we had a liability of $194 million (2010 – $180 million) related
to stock-based compensation recorded at its fair value, including
stock options, restricted share units and deferred share units. In the
year ended December 31, 2011, $45 million (2010 – $58 million) was
paid to holders of stock options, restricted share units and deferred
share units upon exercise using the SAR feature.
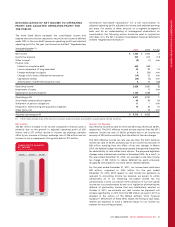
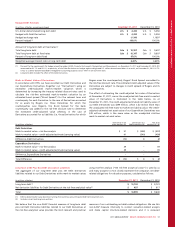
A summary of stock-based compensation expense is as follows:
Years ended December 31,
(In millions of dollars) 2011 2010
Wireless $10 $12
Cable 97
Media 910
Corporate 36 21
$64 $50
Settlement of Pension Obligations
During 2011, we incurred a non-cash loss from the settlement of
pension obligations of approximately $11 million resulting from a
lump-sum contribution of approximately $18 million to our pension
plans, following which the pension plans purchased approximately
$68 million of annuities from insurance companies for all employees
who had retired between January 1, 2009 and January 1, 2011. See
the section entitled “Pension Plans Purchase of Annuities”.
Integration, Restructuring and Acquisition Expenses
During 2011, we incurred $70 million of integration, restructuring
and acquisition expenses to improve our cost structure related to
(i) severance costs associated with the targeted restructuring of our
employee base ($44 million); (ii) acquisition transaction costs incurred
and the integration of acquired businesses ($4 million); and (iii) the
closure of certain Video stores and other exit costs ($22 million).
During 2010, we incurred $40 million of integration, restructuring
and acquisition expenses to improve our cost structure related to
(i) severance costs associated with the targeted restructuring of our
employee base ($21 million); (ii) restructuring expenses related to the
outsourcing of certain information technology functions ($9 million);
(iii) acquisition transaction costs incurred and the integration of
acquired businesses ($5 million); and (iv) the closure of certain Video
stores and lease exit costs ($5 million).
Other Items
There were no other items recorded during 2011. During 2010, we
recorded $14 million of net adjustments related to the resolution of
obligations and accruals relating to prior periods.
Adjusted Operating Profit
As discussed above, Wireless, Cable and Media contributed to the
increase in adjusted operating profit for the year ended December 31,
2011 compared to 2010.
Consolidated adjusted operating profit increased to $4,716 million
in 2011, compared to $4,635 million in 2010. Adjusted operating
profit for 2011 and 2010, respectively, excludes: (i) stock-based
compensation expense of $64 million and $50 million; (ii) settlement
of pension obligations of $11 million and $nil; (iii) integration,
restructuring and acquisition expenses of $70 million and $40 million;
and (iv) other items, net of $nil and $14 million.
For details on the determination of adjusted operating profit, which
is a non-GAAP measure, see the sections entitled “Key Performance
Indicators and Non-GAAP Measures” and “Supplementary
Information: Non-GAAP Calculations”.
Employees
Employee salaries and benefits represent a material portion of our
expenses. At December 31, 2011, we had approximately 26,200
(2010 – 25,100) full-time equivalent employees (“FTEs”) across all of
our operating groups, including our shared services organization and
corporate office, which increased from the level at December 31, 2010
due to higher levels at shared services and customer facing functions.
Total salaries and benefits incurred for employees (both full and part-
time) in 2011 was approximately $1,778 million, compared to
$1,729 million in 2010. Employee salaries and benefits expense
increased due to the number of FTEs compared to 2010, as well as the
increase in stock-based compensation expense to $64 million
compared to a $50 million expense in 2010, due to fluctuations in the
Company’s stock price.
3. CONSOLIDATED LIQUIDITY AND FINANCING
LIQUIDITY AND CAPITAL RESOURCES
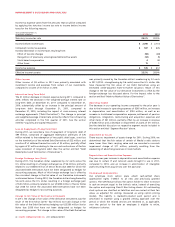
Operations
For 2011, cash generated from operations before changes in non-cash
operating items, which is calculated by removing the effect of all
non-cash items from net income, increased to $4,698 million from
$4,683 million in 2010. Taking into account the changes in non-cash
working capital items, income taxes paid and interest paid, for 2011,
cash generated from operations was $3,791 million, compared to
$3,494 million in 2010. The $297 million increase is primarily the result
of a $217 million increase in non-cash working capital items, a
$53 million decrease in taxes paid, and a $12 million decrease in
interest paid. The cash generated from operations, together with the
following items, resulted in total net funds of approximately
$5,894 million in 2011:
• the receipt of an aggregate $1,850 million gross proceeds from the
March 21, 2011 issuance of $1,450 million of 5.34% Senior Notes
due 2021 and $400 million of 6.56% Senior Notes due 2041;
• $250 million net advances borrowed under the bank credit facility;
and
• $3 million from the issuance of Class B Non-Voting shares under the
exercise of employee stock options.
Net funds used during 2011 totalled approximately $5,906 million, the
details of which include the following:
• additions to PP&E of $2,216 million, including $89 million of
related changes in non-cash working capital;
2011 ANNUAL REPORT ROGERS COMMUNICATIONS INC. 47