Rogers 2011 Annual Report Download - page 75
Download and view the complete annual report
Please find page 75 of the 2011 Rogers annual report below. You can navigate through the pages in the report by either clicking on the pages listed below, or by using the keyword search tool below to find specific information within the annual report.-
 1
1 -
2
-
3
-
4
-
5
-
6
-
7
-
8
-
9
-
10
-
11
-
12
-
13
-
14
-
15
-
16
-
17
-
18
-
19
-
20
-
21
-
22
-
23
-
24
-
25
-
26
-
27
-
28
-
29
-
30
-
31
-
32
-
33
-
34
-
35
-
36
-
37
-
38
-
39
-
40
-
41
-
42
-
43
-
44
-
45
-
46
-
47
-
48
-
49
-
50
-
51
-
52
-
53
-
54
-
55
-
56
-
57
-
58
-
59
-
60
-
61
-
62
-
63
-
64
-
 65
65 -
 66
66 -
 67
67 -
 68
68 -
 69
69 -
 70
70 -
 71
71 -
 72
72 -
 73
73 -
 74
74 -
 75
75 -
 76
76 -
 77
77 -
 78
78 -
 79
79 -
 80
80 -
 81
81 -
 82
82 -
 83
83 -
 84
84 -
 85
85 -
86
-
87
-
88
-
89
-
90
-
91
-
92
-
93
-
94
-
95
-
96
-
97
-
98
-
99
-
100
-
101
-
102
-
103
-
104
-
105
-
106
-
107
-
108
-
109
-
110
-
111
-
112
-
113
-
114
-
115
-
116
-
117
-
118
-
119
-
120
-
121
-
122
-
123
-
124
-
125
-
126
-
127
-
128
-
129
-
130
-
131
-
132
-
133
-
134
-
135
-
136
 |
 |

MANAGEMENT’S DISCUSSION AND ANALYSIS
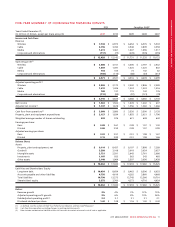
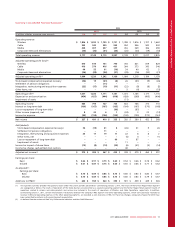
FIVE-YEAR SUMMARY OF CONSOLIDATED FINANCIAL RESULTS
IFRS Canadian GAAP
Years Ended December 31,
(In millions of dollars, except per share amounts) 2011 2010 2009 2008 2007
Income and Cash Flow:
Revenue
Wireless $ 7,138 $ 6,973 $ 6,654 $ 6,335 $ 5,503
Cable 3,796 3,785 3,948 3,809 3,558
Media 1,611 1,461 1,407 1,496 1,317
Corporate and eliminations (117) (77) (278) (305) (255)
$ 12,428 $ 12,142 $ 11,731 $ 11,335 $ 10,123
Operating profit(1)
Wireless $ 3,008 $ 3,151 $ 3,006 $ 2,797 $ 2,532
Cable 1,559 1,391 1,325 1,220 802
Media 154 105 73 142 82
Corporate and eliminations (150) (116) (88) (81) (317)
$ 4,571 $ 4,531 $ 4,316 $ 4,078 $ 3,099
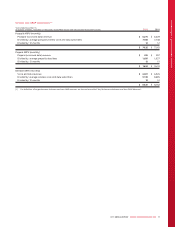
Adjusted operating profit(1)
Wireless $ 3,036 $ 3,173 $ 3,042 $ 2,806 $ 2,589
Cable 1,612 1,426 1,324 1,233 1,016
Media 180 131 119 142 176
Corporate and eliminations (112) (95) (97) (121) (78)
$ 4,716 $ 4,635 $ 4,388 $ 4,060 $ 3,703
Net income $ 1,563 $ 1,502 $ 1,478 $ 1,002 $ 637
Adjusted net income(1) $ 1,747 $ 1,678 $ 1,556 $ 1,260 $ 1,066
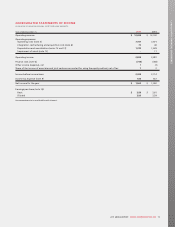
Cash flow from operations(2) $ 3,960 $ 3,880 $ 3,526 $ 3,500 $ 3,135
Property, plant and equipment expenditures $ 2,127 $ 1,834 $ 1,855 $ 2,021 $ 1,796
Weighted average number of shares outstanding 543 576 621 638 642
Earnings per share:
Basic $ 2.88 $ 2.61 $ 2.38 $ 1.57 $ 1.00
Diluted 2.86 2.59 2.38 1.57 0.99
Adjusted earnings per share:
Basic $ 3.22 $ 2.91 $ 2.51 $ 1.98 $ 1.67
Diluted 3.19 2.89 2.51 1.98 1.66
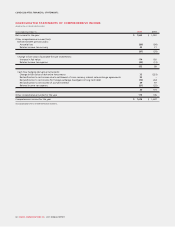
Balance Sheet:
Assets
Property, plant and equipment, net $ 9,114 $ 8,437 $ 8,197 $ 7,898 $ 7,289
Goodwill 3,280 3,108 3,018 3,024 3,027
Intangible assets 2,721 2,591 2,643 2,761 2,086
Investments 1,107 933 563 343 485
Other assets 2,140 1,964 2,597 3,056 2,438
$ 18,362 $ 17,033 $ 17,018 $ 17,082 $ 15,325
Liabilities and Shareholders’ Equity
Long-term debt $ 10,034 $ 8,654 $ 8,463 $ 8,506 $ 6,033
Accounts payable and other liabilities 4,756 4,619 4,282 3,860 4,668
Total liabilities 14,790 13,273 12,745 12,366 10,701
Shareholders’ equity 3,572 3,760 4,273 4,716 4,624
$ 18,362 $ 17,033 $ 17,018 $ 17,082 $ 15,325
Ratios:
Revenue growth 2% 4% 3% 12% 15%
Adjusted operating profit growth 2% 6% 8% 10% 26%
Debt/adjusted operating profit(3) 2.2 2.1 2.1 2.1 2.1
Dividends declared per share $ 1.42 $ 1.28 $ 1.16 $ 1.00 $ 0.42
(1) As defined. See the section entitled “Key Performance Indicators and Non-GAAP Measures”.
(2) Cash flow from operations excluding changes in working capital amounts.
(3) Debt includes net derivative liabilities at the risk free mark-to-market value and is net of cash as applicable.
2011 ANNUAL REPORT ROGERS COMMUNICATIONS INC. 71