Rogers 2011 Annual Report Download - page 41
Download and view the complete annual report
Please find page 41 of the 2011 Rogers annual report below. You can navigate through the pages in the report by either clicking on the pages listed below, or by using the keyword search tool below to find specific information within the annual report.-
 1
1 -
2
-
3
-
4
-
5
-
6
-
7
-
8
-
9
-
10
-
11
-
12
-
13
-
14
-
15
-
16
-
17
-
18
-
19
-
20
-
21
-
22
-
23
-
24
-
25
-
26
-
27
-
28
-
29
-
30
-
 31
31 -
 32
32 -
 33
33 -
 34
34 -
 35
35 -
 36
36 -
 37
37 -
 38
38 -
 39
39 -
 40
40 -
 41
41 -
 42
42 -
 43
43 -
 44
44 -
 45
45 -
 46
46 -
 47
47 -
 48
48 -
 49
49 -
 50
50 -
 51
51 -
52
-
53
-
54
-
55
-
56
-
57
-
58
-
59
-
60
-
61
-
62
-
63
-
64
-
65
-
66
-
67
-
68
-
69
-
70
-
71
-
72
-
73
-
74
-
75
-
76
-
77
-
78
-
79
-
80
-
81
-
82
-
83
-
84
-
85
-
86
-
87
-
88
-
89
-
90
-
91
-
92
-
93
-
94
-
95
-
96
-
97
-
98
-
99
-
100
-
101
-
102
-
103
-
104
-
105
-
106
-
107
-
108
-
109
-
110
-
111
-
112
-
113
-
114
-
115
-
116
-
117
-
118
-
119
-
120
-
121
-
122
-
123
-
124
-
125
-
126
-
127
-
128
-
129
-
130
-
131
-
132
-
133
-
134
-
135
-
136
 |
 |
MANAGEMENT’S DISCUSSION AND ANALYSIS
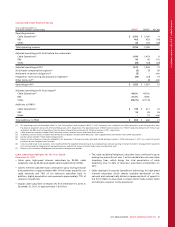
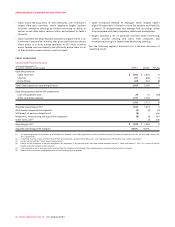
Summarized Subscriber Results
Years ended December 31,
(Subscriber statistics in thousands) 2011 2010 Chg
Cable homes passed(1) 3,754 3,708 46
Television
Net additions (losses) (14) 4 (18)
Total television subscribers(1) 2,297 2,305 (8)
Digital Cable
Households, net additions 39 67 (28)
Total digital cable households(1) 1,777 1,733 44
Cable high-speed Internet
Net additions(2) 8364 19
Total cable high-speed Internet subscribers(1)(2) 1,793 1,686 107
Cable telephony lines
Net additions and migrations 45 66 (21)
Total cable telephony lines(1) 1,052 1,003 49
Total cable service units(3)
Net additions 114 134 (20)
Total cable service units 5,142 4,994 148
Circuit-switched lines
Net losses and migrations to cable telephony platform (12) (48) 36
Total circuit-switched lines(4) –46 (46)
(1) On February 28, 2011, we acquired 6,000 television subscribers, 5,000 digital cable households, 4,000 cable high-speed Internet subscribers and 4,000 cable telephony lines
from our acquisition of Compton. These subscribers are not included in net additions, but are included in the ending total balance for 2011. In addition, the acquisition
resulted in an increase in cable homes passed of 9,000.
(2) Effective April 1, 2011, approximately 20,000 wholesale cable Internet subscribers which were previously included in RBS are now included in Cable. The transfer of these
20,000 subscribers was recorded as an adjustment to the total subscriber base for 2011. Incremental subscriber activity for this base is included in net additions for 2011.
(3) Total cable service units are comprised of television subscribers, cable high-speed Internet subscribers and cable telephony lines.
(4) During 2011, approximately 34,000 circuit-switched lines were migrated to third-party resellers, with the exception of approximately 3,000 which were migrated to RBS in the
first quarter of 2011. These migrations are not included in net losses and migrations, but are included in the ending total balance for 2011.
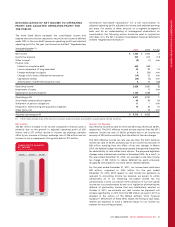
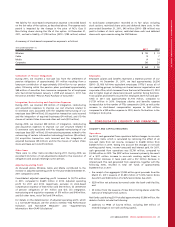
Television Internet Home Phone
(In millions of dollars)
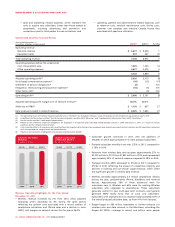
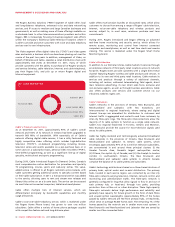
CABLE OPERATIONS
REVENUE BREAKDOWN
781848 927
1,780 1,835 1,904
513 507 478
2009 20102011
(In millions of dollars)
CABLE OPERATIONS ADJUSTED
OPERATING PROFIT
AND MARGIN
$1,298 $1,419$1,549
2009 20102011
42.2% 44.5% 46.8%
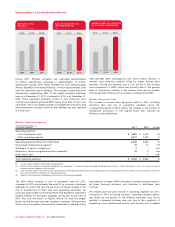
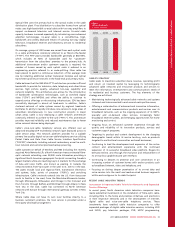
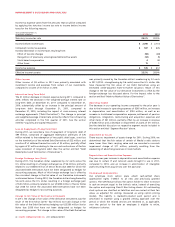
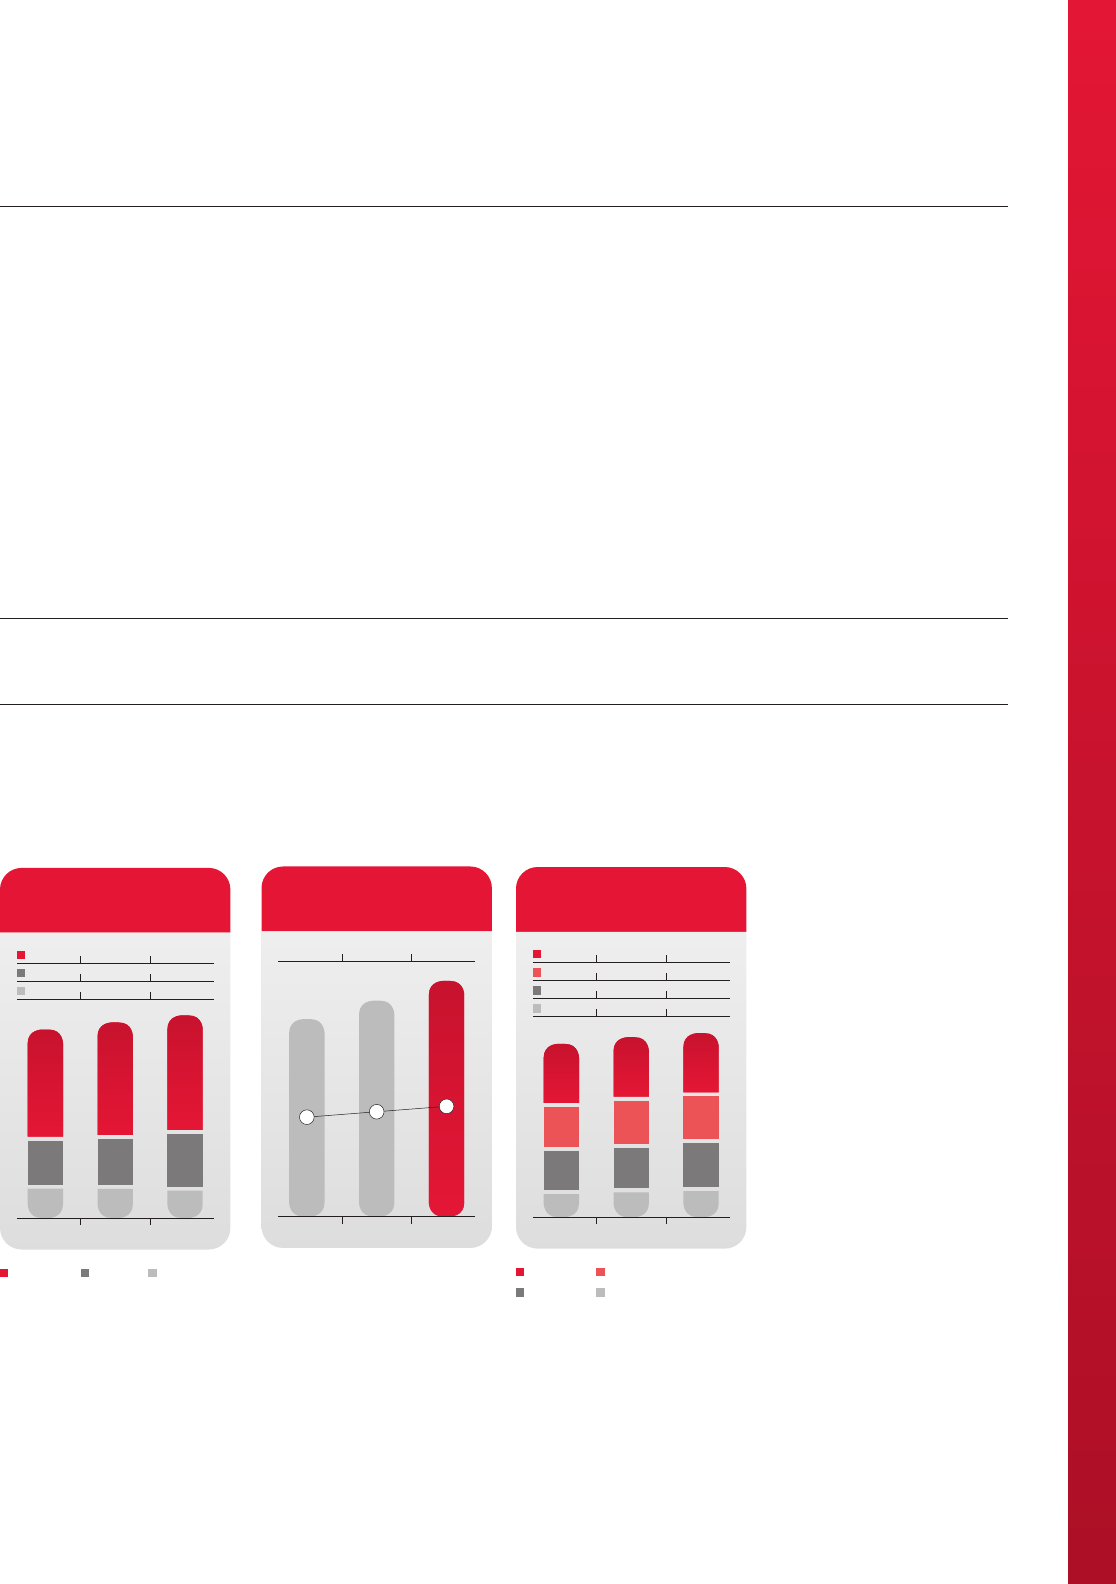
Television Digital
Internet Home Phone
(In thousands)
CABLE SUBSCRIBER
BREAKDOWN
1,6641,733 1,777
2,2962,305 2,297
1,6191,6861,793
937 1,003 1,052
2009 20102011
2011 ANNUAL REPORT ROGERS COMMUNICATIONS INC. 37