Rogers 2011 Annual Report Download - page 32
Download and view the complete annual report
Please find page 32 of the 2011 Rogers annual report below. You can navigate through the pages in the report by either clicking on the pages listed below, or by using the keyword search tool below to find specific information within the annual report.-
 1
1 -
2
-
3
-
4
-
5
-
6
-
7
-
8
-
9
-
10
-
11
-
12
-
13
-
14
-
15
-
16
-
17
-
18
-
19
-
20
-
21
-
 22
22 -
 23
23 -
 24
24 -
 25
25 -
 26
26 -
 27
27 -
 28
28 -
 29
29 -
 30
30 -
 31
31 -
 32
32 -
 33
33 -
 34
34 -
 35
35 -
 36
36 -
 37
37 -
 38
38 -
 39
39 -
 40
40 -
 41
41 -
 42
42 -
43
-
44
-
45
-
46
-
47
-
48
-
49
-
50
-
51
-
52
-
53
-
54
-
55
-
56
-
57
-
58
-
59
-
60
-
61
-
62
-
63
-
64
-
65
-
66
-
67
-
68
-
69
-
70
-
71
-
72
-
73
-
74
-
75
-
76
-
77
-
78
-
79
-
80
-
81
-
82
-
83
-
84
-
85
-
86
-
87
-
88
-
89
-
90
-
91
-
92
-
93
-
94
-
95
-
96
-
97
-
98
-
99
-
100
-
101
-
102
-
103
-
104
-
105
-
106
-
107
-
108
-
109
-
110
-
111
-
112
-
113
-
114
-
115
-
116
-
117
-
118
-
119
-
120
-
121
-
122
-
123
-
124
-
125
-
126
-
127
-
128
-
129
-
130
-
131
-
132
-
133
-
134
-
135
-
136
 |
 |

MANAGEMENT’S DISCUSSION AND ANALYSIS
• sales and marketing related expenses, which represent the
costs to acquire new subscribers (other than those related to
equipment), including advertising and promotion and
commissions paid to third parties for new activations; and
• operating, general and administrative related expenses, such
as retention costs, network maintenance costs, facility costs,
customer care expenses and Industry Canada license fees
associated with spectrum utilization.
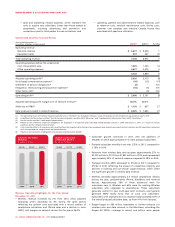
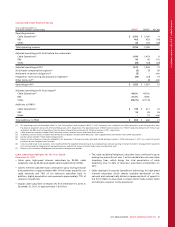
Summarized Wireless Financial Results
Years ended December 31,
(In millions of dollars, except margin) 2011(1) 2010(1) % Chg
Operating revenue
Network revenue $ 6,601 $ 6,526 1
Equipment sales 537 447 20
Total operating revenue 7,1386,973 2
Operating expenses before the undernoted
Cost of equipment sales 1,425 1,225 16
Other operating expenses 2,677 2,575 4
4,102 3,800 8
Adjusted operating profit(2) 3,036 3,173 (4)
Stock-based compensation expense(3) (10) (12) (17)
Settlement of pension obligations(4) (2) – n/m
Integration, restructuring and acquisition expenses(5) (16) (5) n/m
Other items, net(6) –(5) n/m
Operating profit(2) $ 3,008$ 3,151 (5)
Adjusted operating profit margin as % of network revenue(2) 46.0%48.6%
Additions to PP&E(2) $ 1,192 $ 937 27
Data revenue included in network revenue $ 2,325 $ 1,832 27
(1) The operating results of Cityfone Telecommunications Inc. (“Cityfone”) are included in Wireless’ results of operations from the date of acquisition on July 9, 2010.
(2) As defined. See the sections entitled “Key Performance Indicators and Non-GAAP Measures” and “Supplementary Information: Non-GAAP Calculations”.
(3) See the section entitled “Stock-based Compensation”.
(4) Relates to the settlement of pension obligations for employees in the pension plans who had retired between January 1, 2009 and January 1, 2011, as a result of annuity
purchases by the Company’s pension plans.
(5) Costs incurred relate to (i) severance costs resulting from the targeted restructuring of our employee base and outsourcing of certain functions and (ii) acquisition transaction
costs incurred and the integration of acquired businesses.
(6) Relates to the resolution of obligations and accruals relating to prior periods.
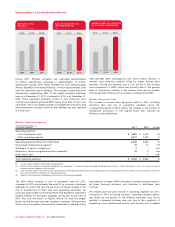
(In millions of dollars)
WIRELESS NETWORK
REVENUE
$6,245 $6,526$6,601
2009 20102011
(In millions of dollars)
WIRELESS ADJUSTED
OPERATING PROFIT
$3,042 $3,173 $3,036
2009 20102011
Wireless Operating Highlights for the Year Ended
December 31, 2011
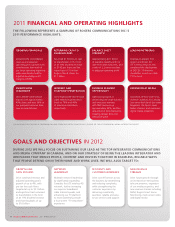
• Wireless revenue increased by 2% from 2010 while adjusted
operating profit decreased by 4% during the same period
reflecting the upfront costs associated with a record number of
smartphone activations and iPhone sales and a decline in voice
ARPU, with margins on network services for the year at 46.0%.
• Subscriber growth continued in 2011, with net additions of
378,000, of which approximately 71% were postpaid subscribers.
• Postpaid subscriber monthly churn was 1.32% in 2011, compared to
1.18% in 2010.
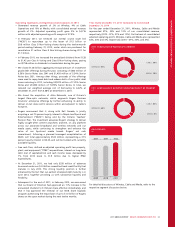
• Revenues from wireless data services grew approximately 27% to
$2,325 million in 2011 from $1,832 million in 2010, and represented
approximately 35% of network revenue compared to 28% in 2010.
• Postpaid monthly ARPU decreased to $70.26 in 2011 compared to
$72.62 in 2010, reflecting the impact of competitive intensity and
declines in roaming and out-of-plan usage revenues, which offset
the significant growth in wireless data revenue.
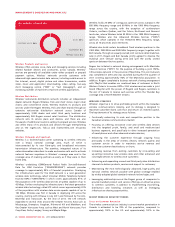
• Wireless activated approximately 2.5 million smartphone devices
during the year, predominantly iPhone, BlackBerry and Android
devices. Approximately 38% of these activations were for
subscribers new to Wireless and 62% were for existing Wireless
subscribers who upgraded to smartphones. These subscribers
generally commit to new multi-year term contracts, and typically
generate ARPU nearly twice that of voice only subscribers.
Subscribers with smartphones now represent approximately 56% of
the overall postpaid subscriber base, up from 41% from last year.
• Rogers began an $80 million investment to further enhance our
wireless voice and data network in the Maritimes, extending the
Rogers 4G HSPA+ coverage to almost one million more people
28 ROGERS COMMUNICATIONS INC. 2011 ANNUAL REPORT